Maximize PostgreSQL Performance
pgDash provides a range of innovative diagnostic and monitoring features to help you gain insight and maximise the performance of your PostgreSQL deployment.
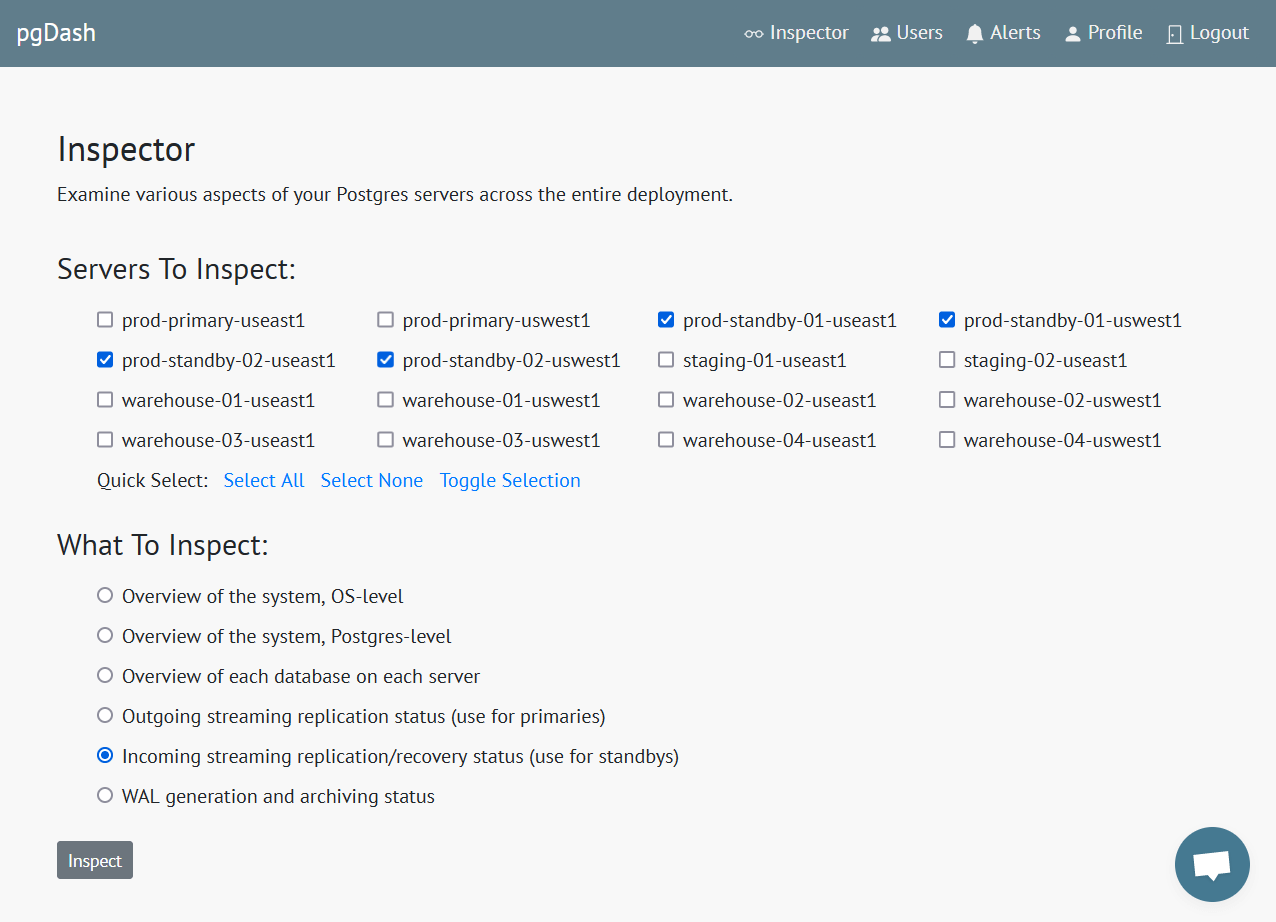
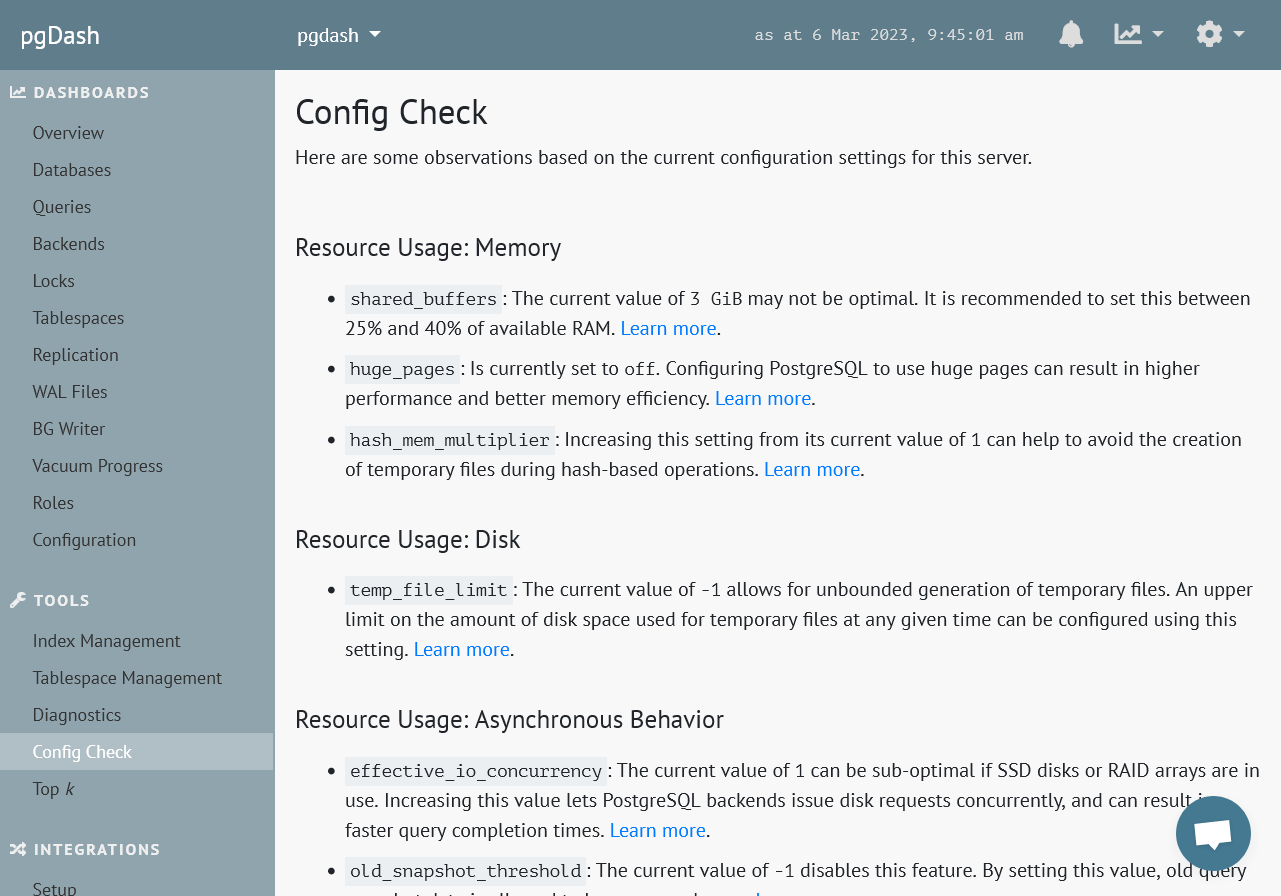
Diagnostics
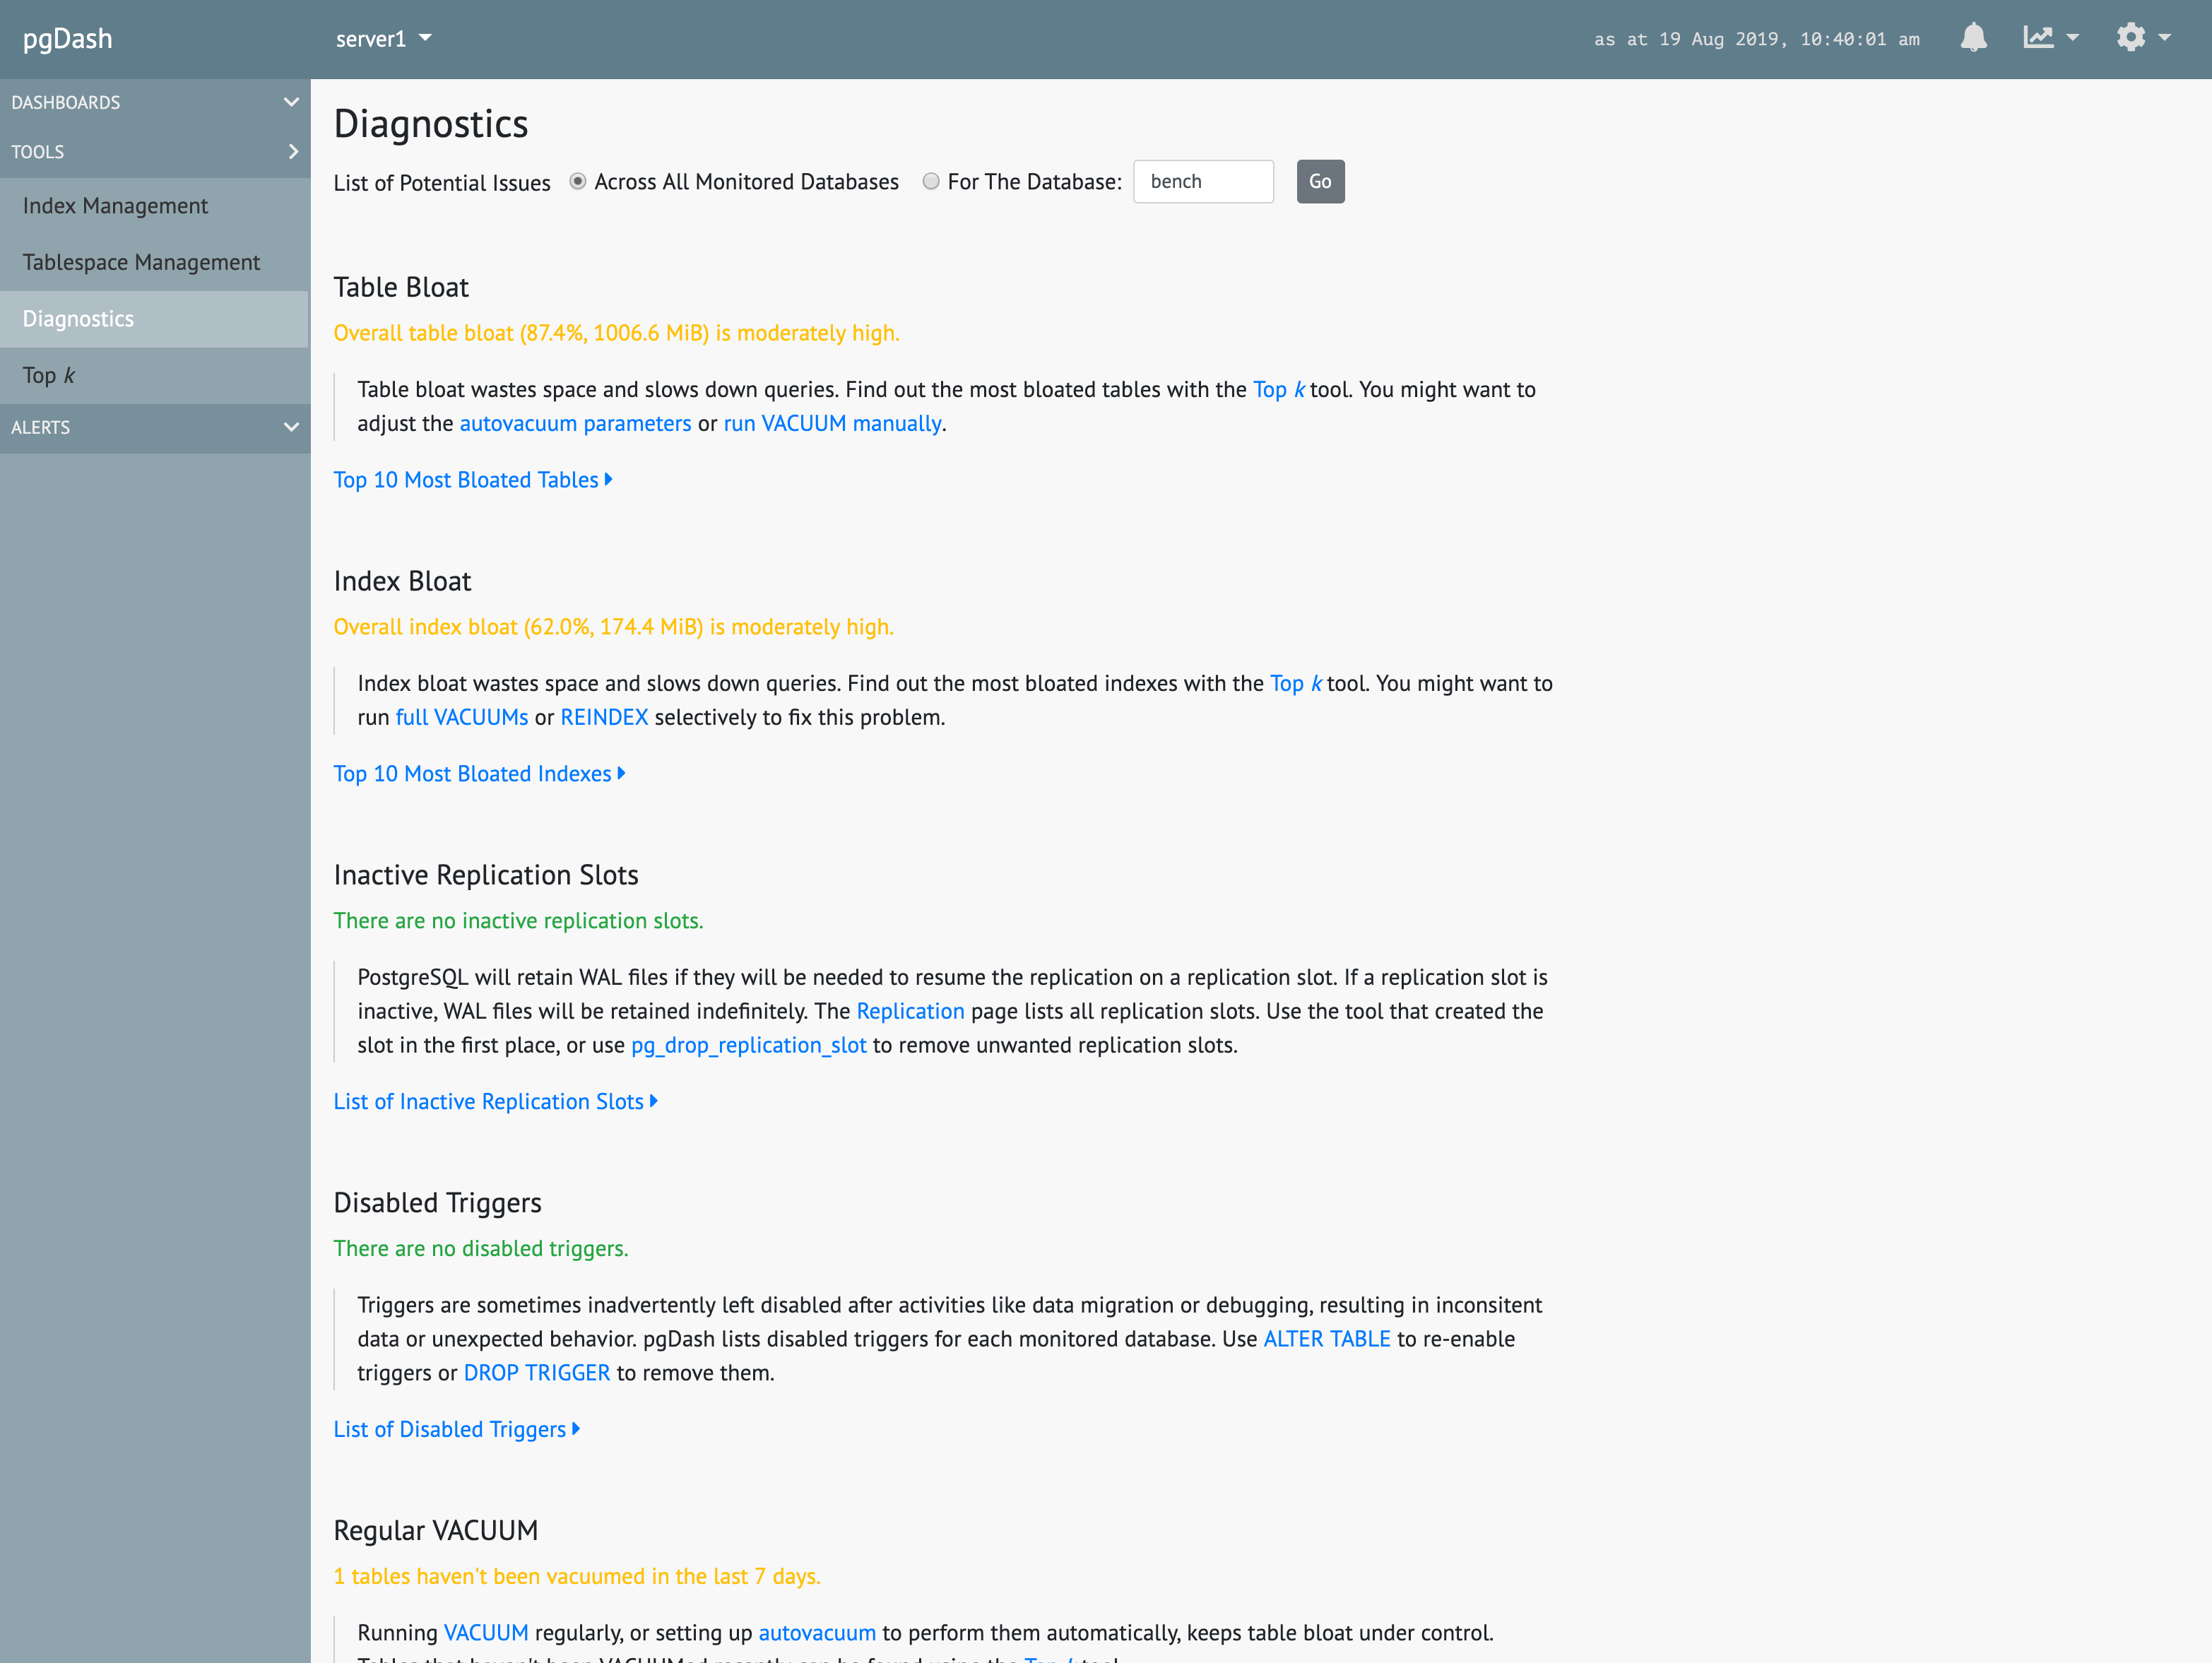
Review automatically generated Diagnostic reports that examine your PostgreSQL servers and databases and highlight issues that can impact the health and performance of your deployment.
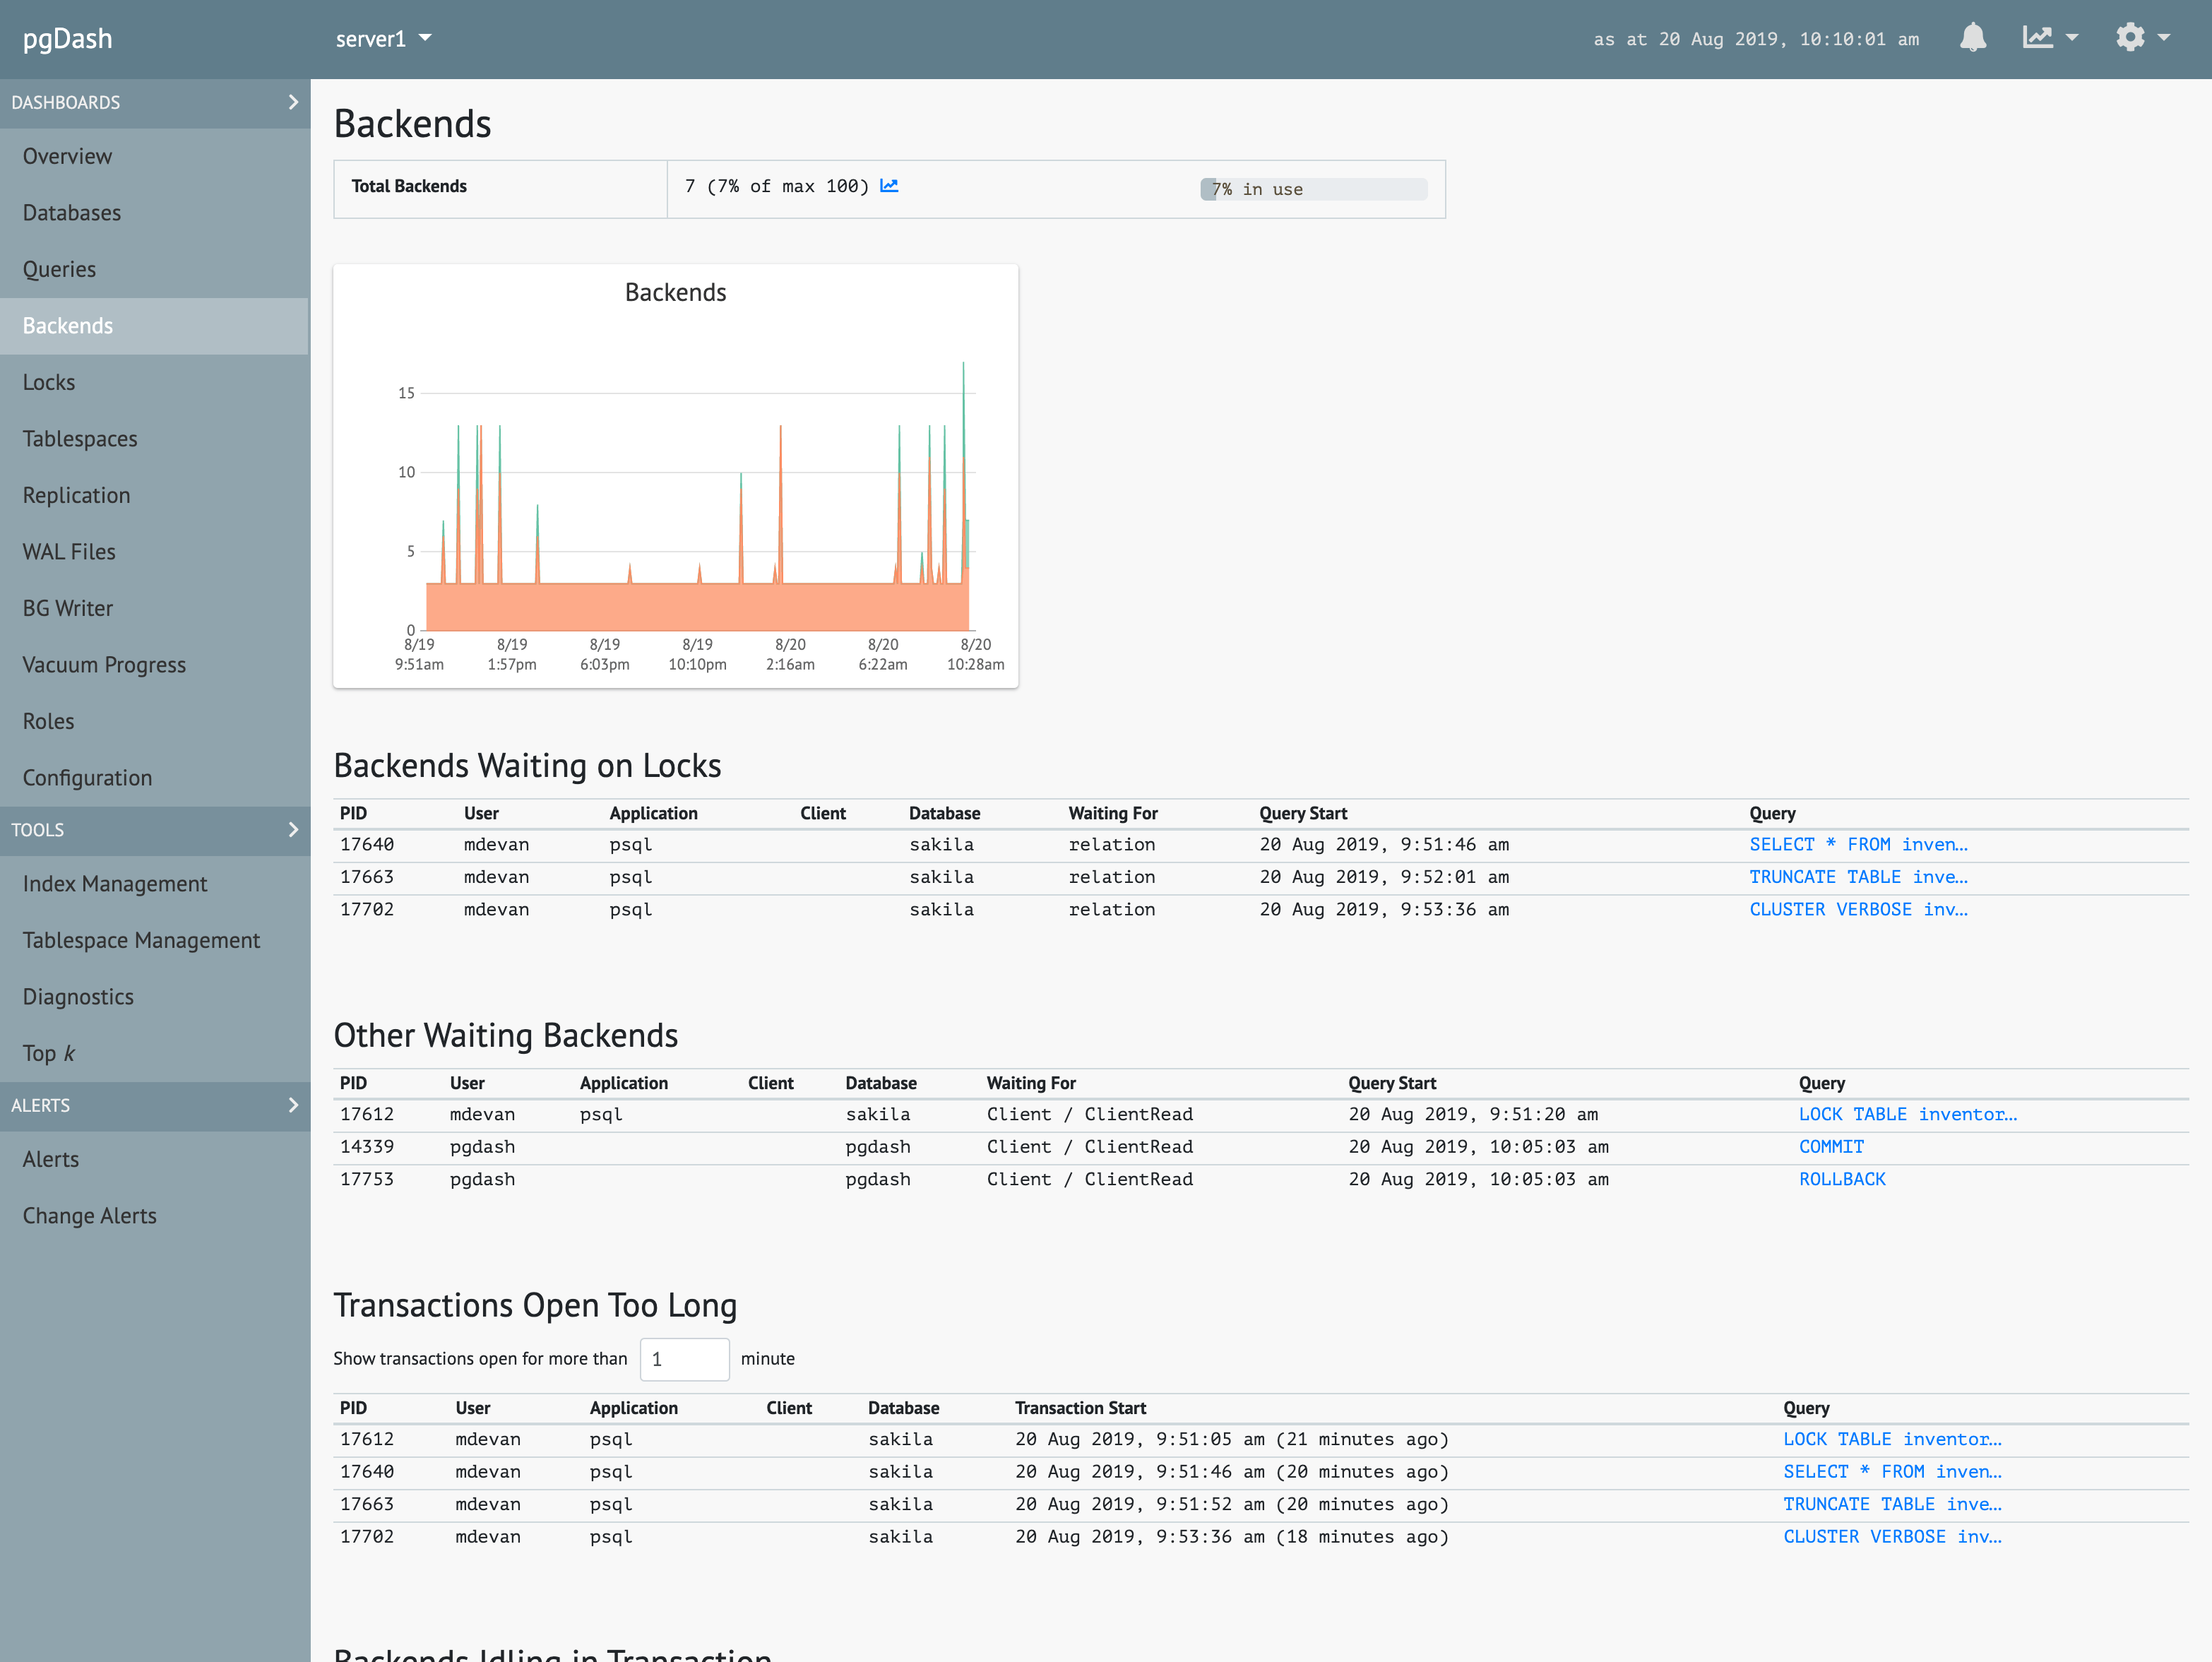
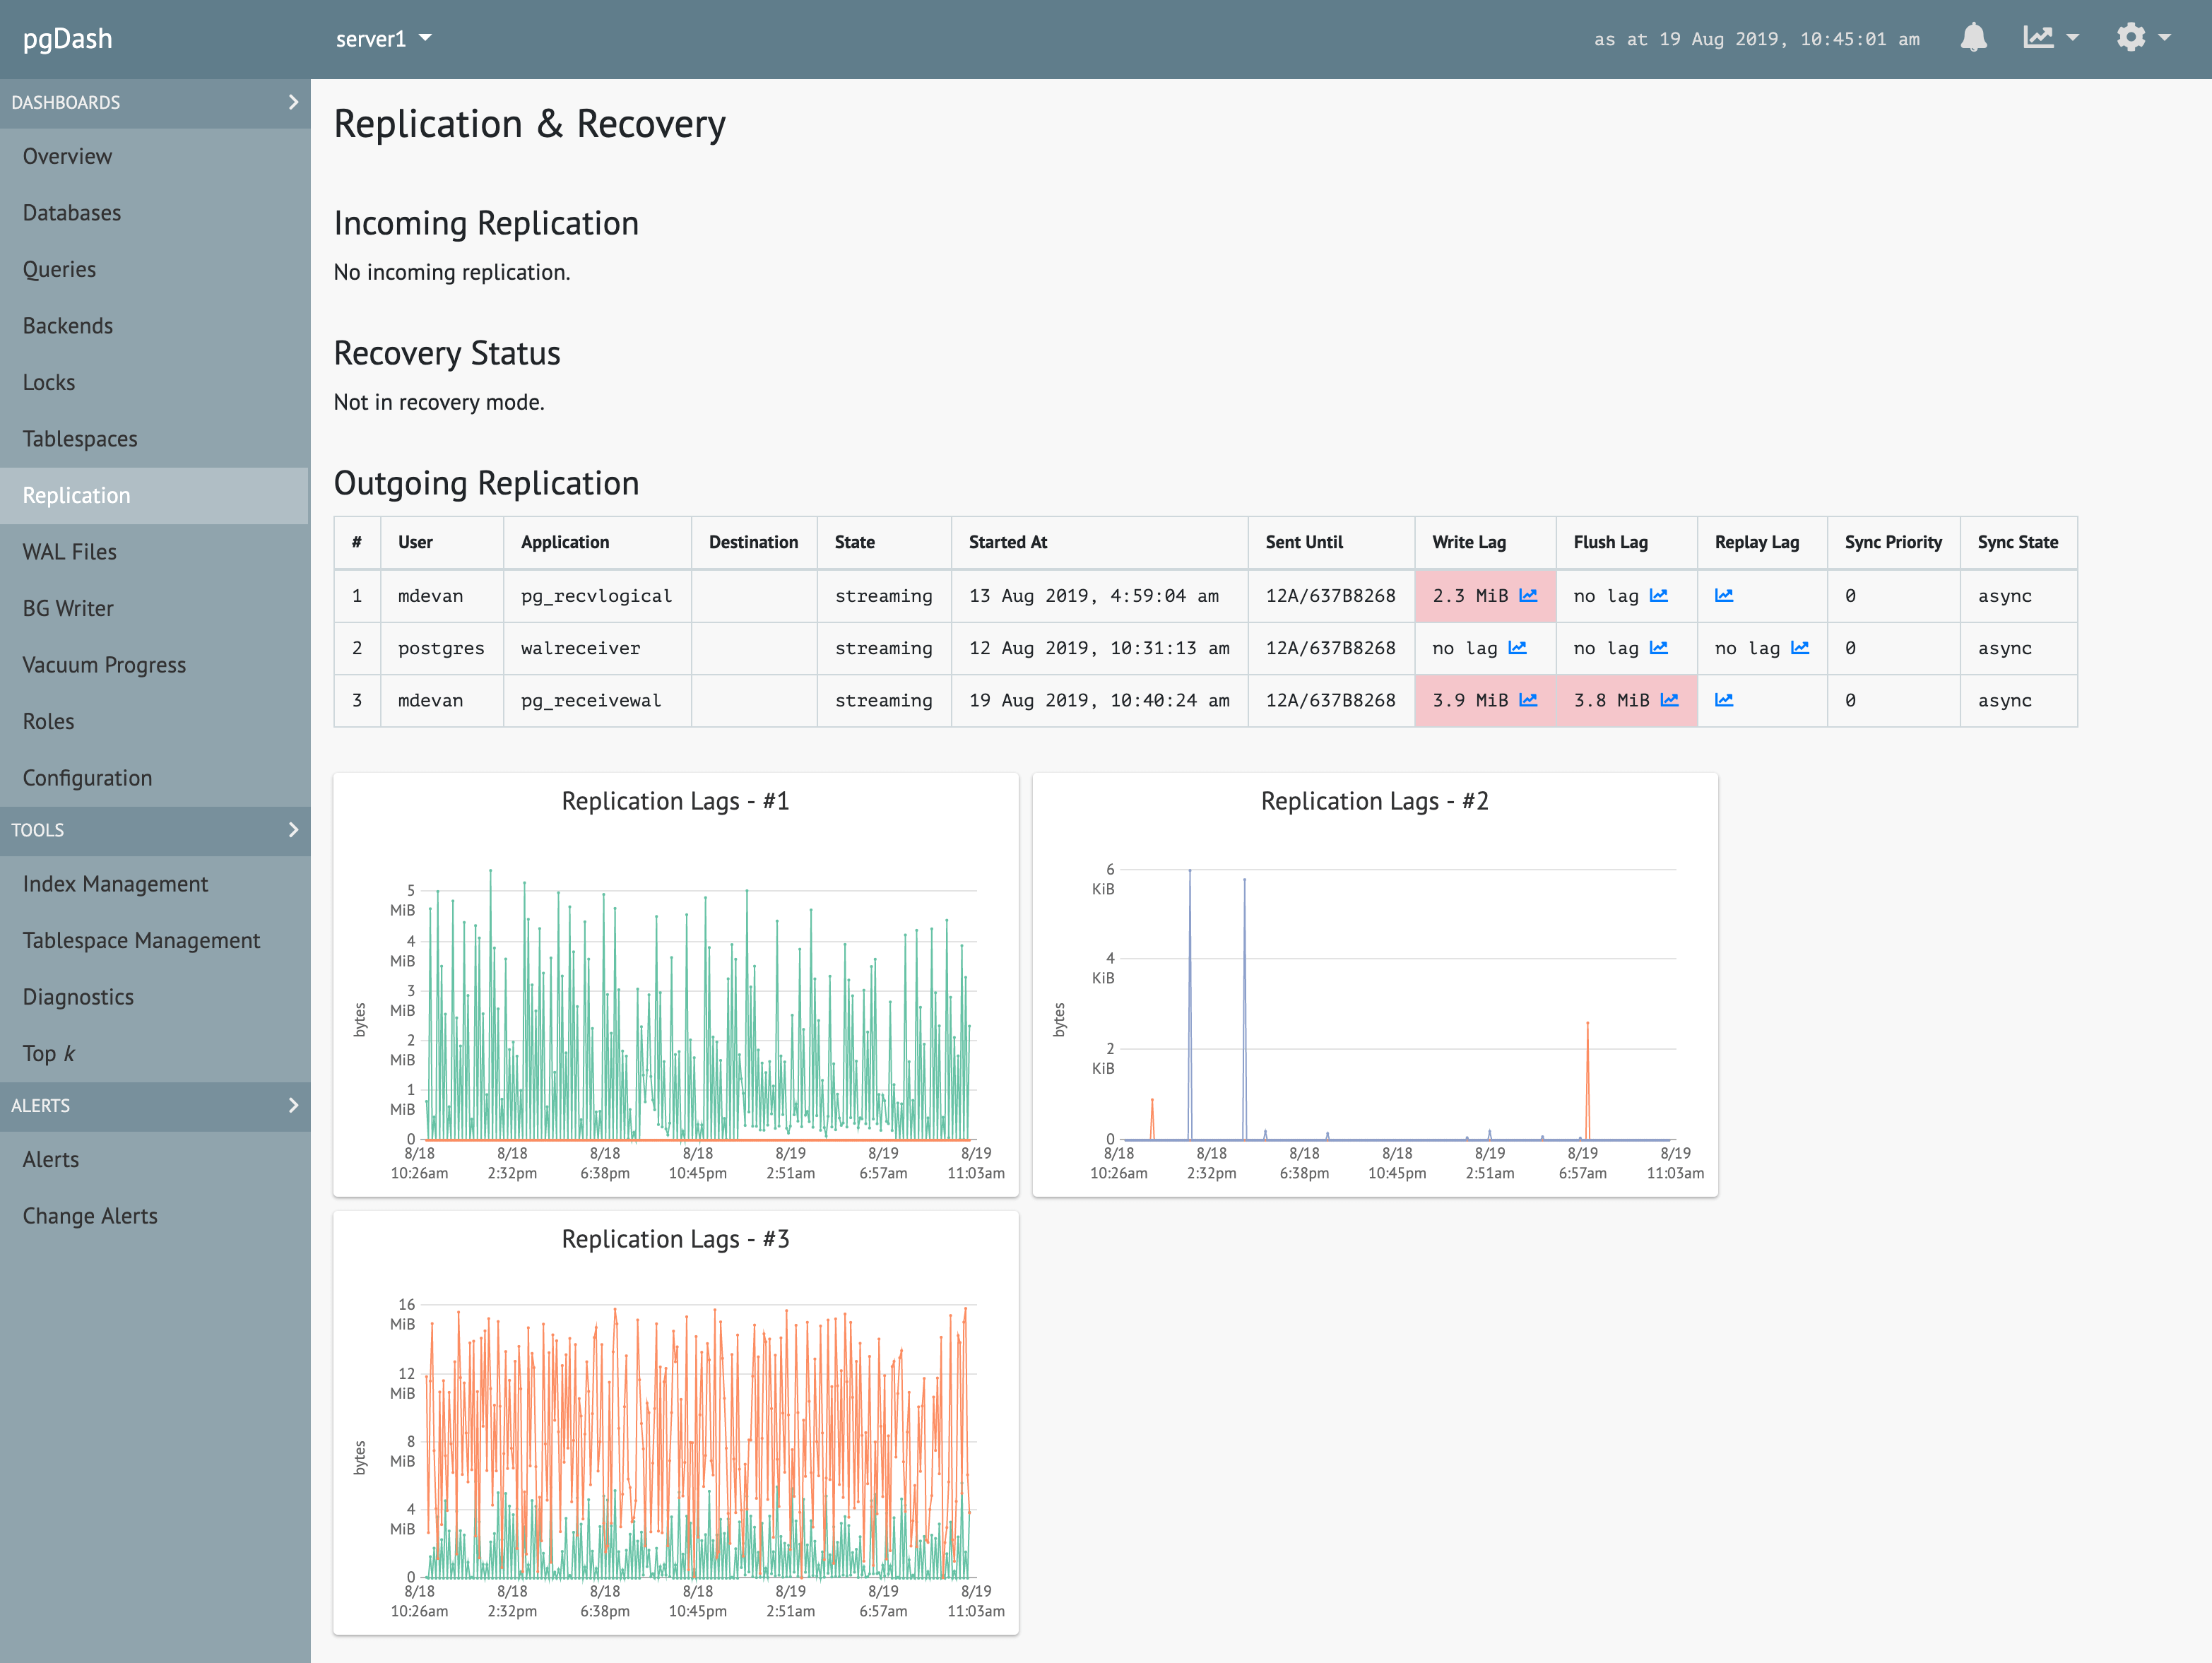
Locks & Backends
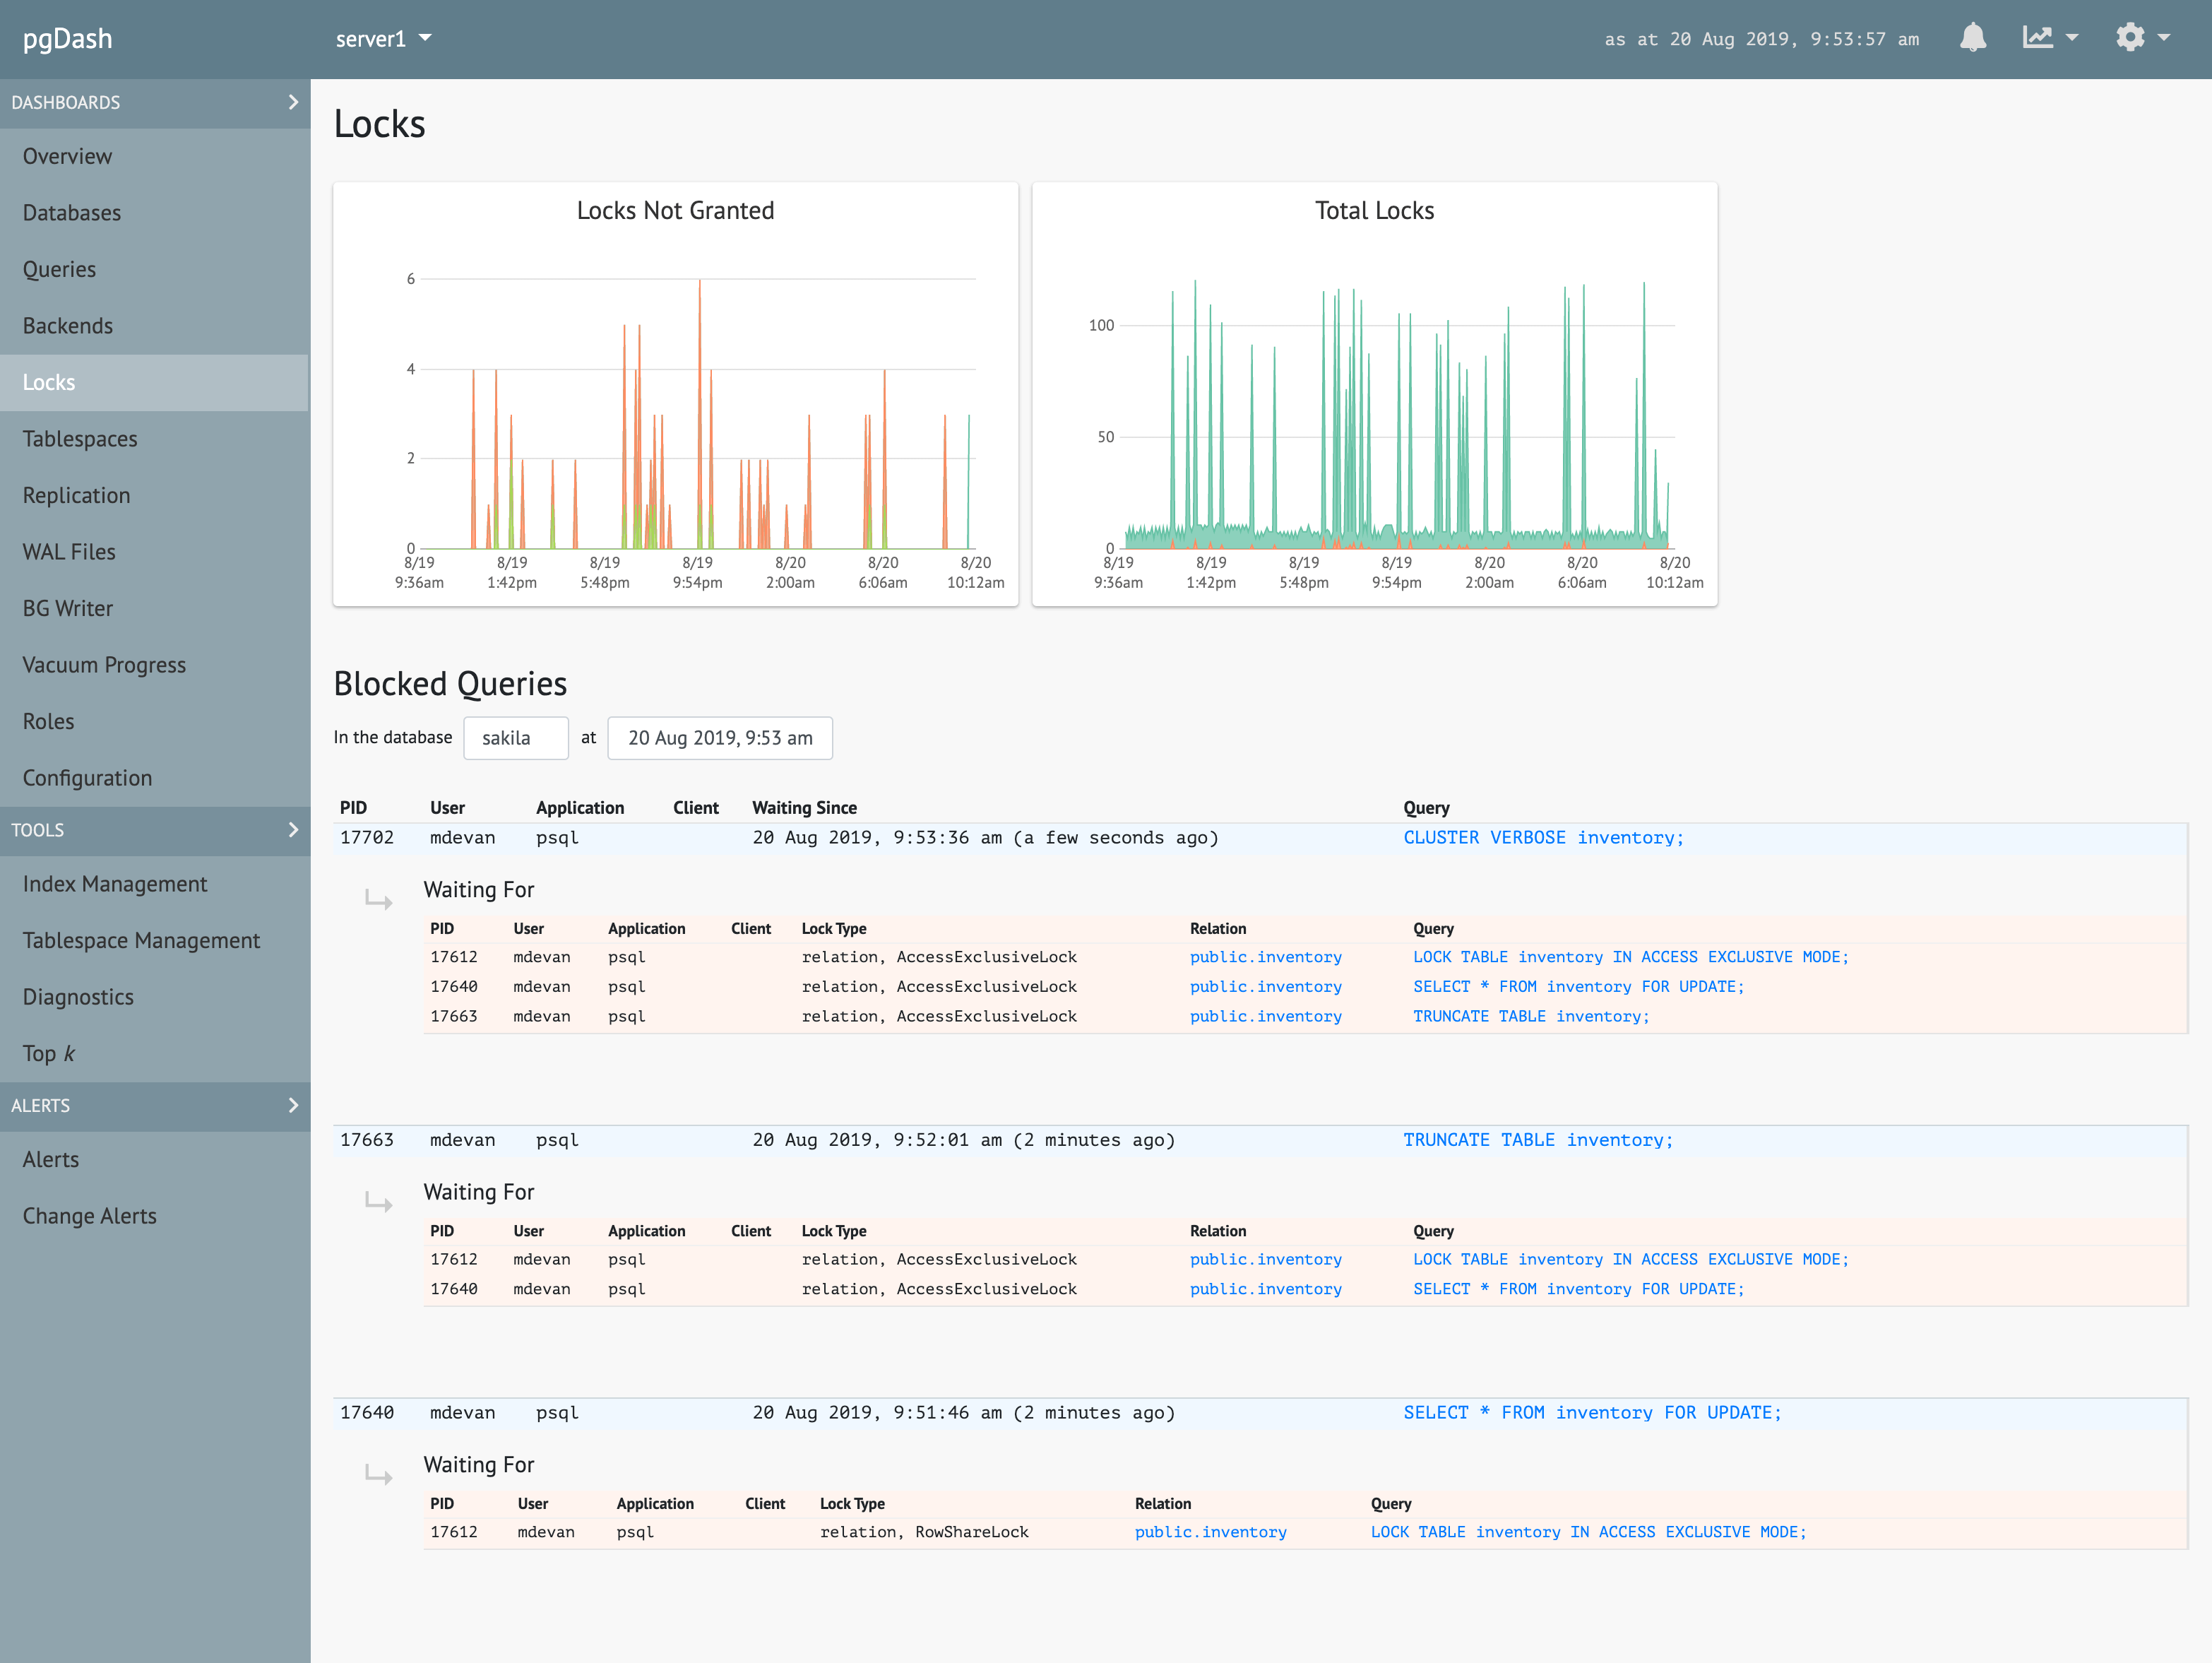
See which queries are waiting for which others. Track backends waiting on locks, transactions that have been open too long and idling transactions.
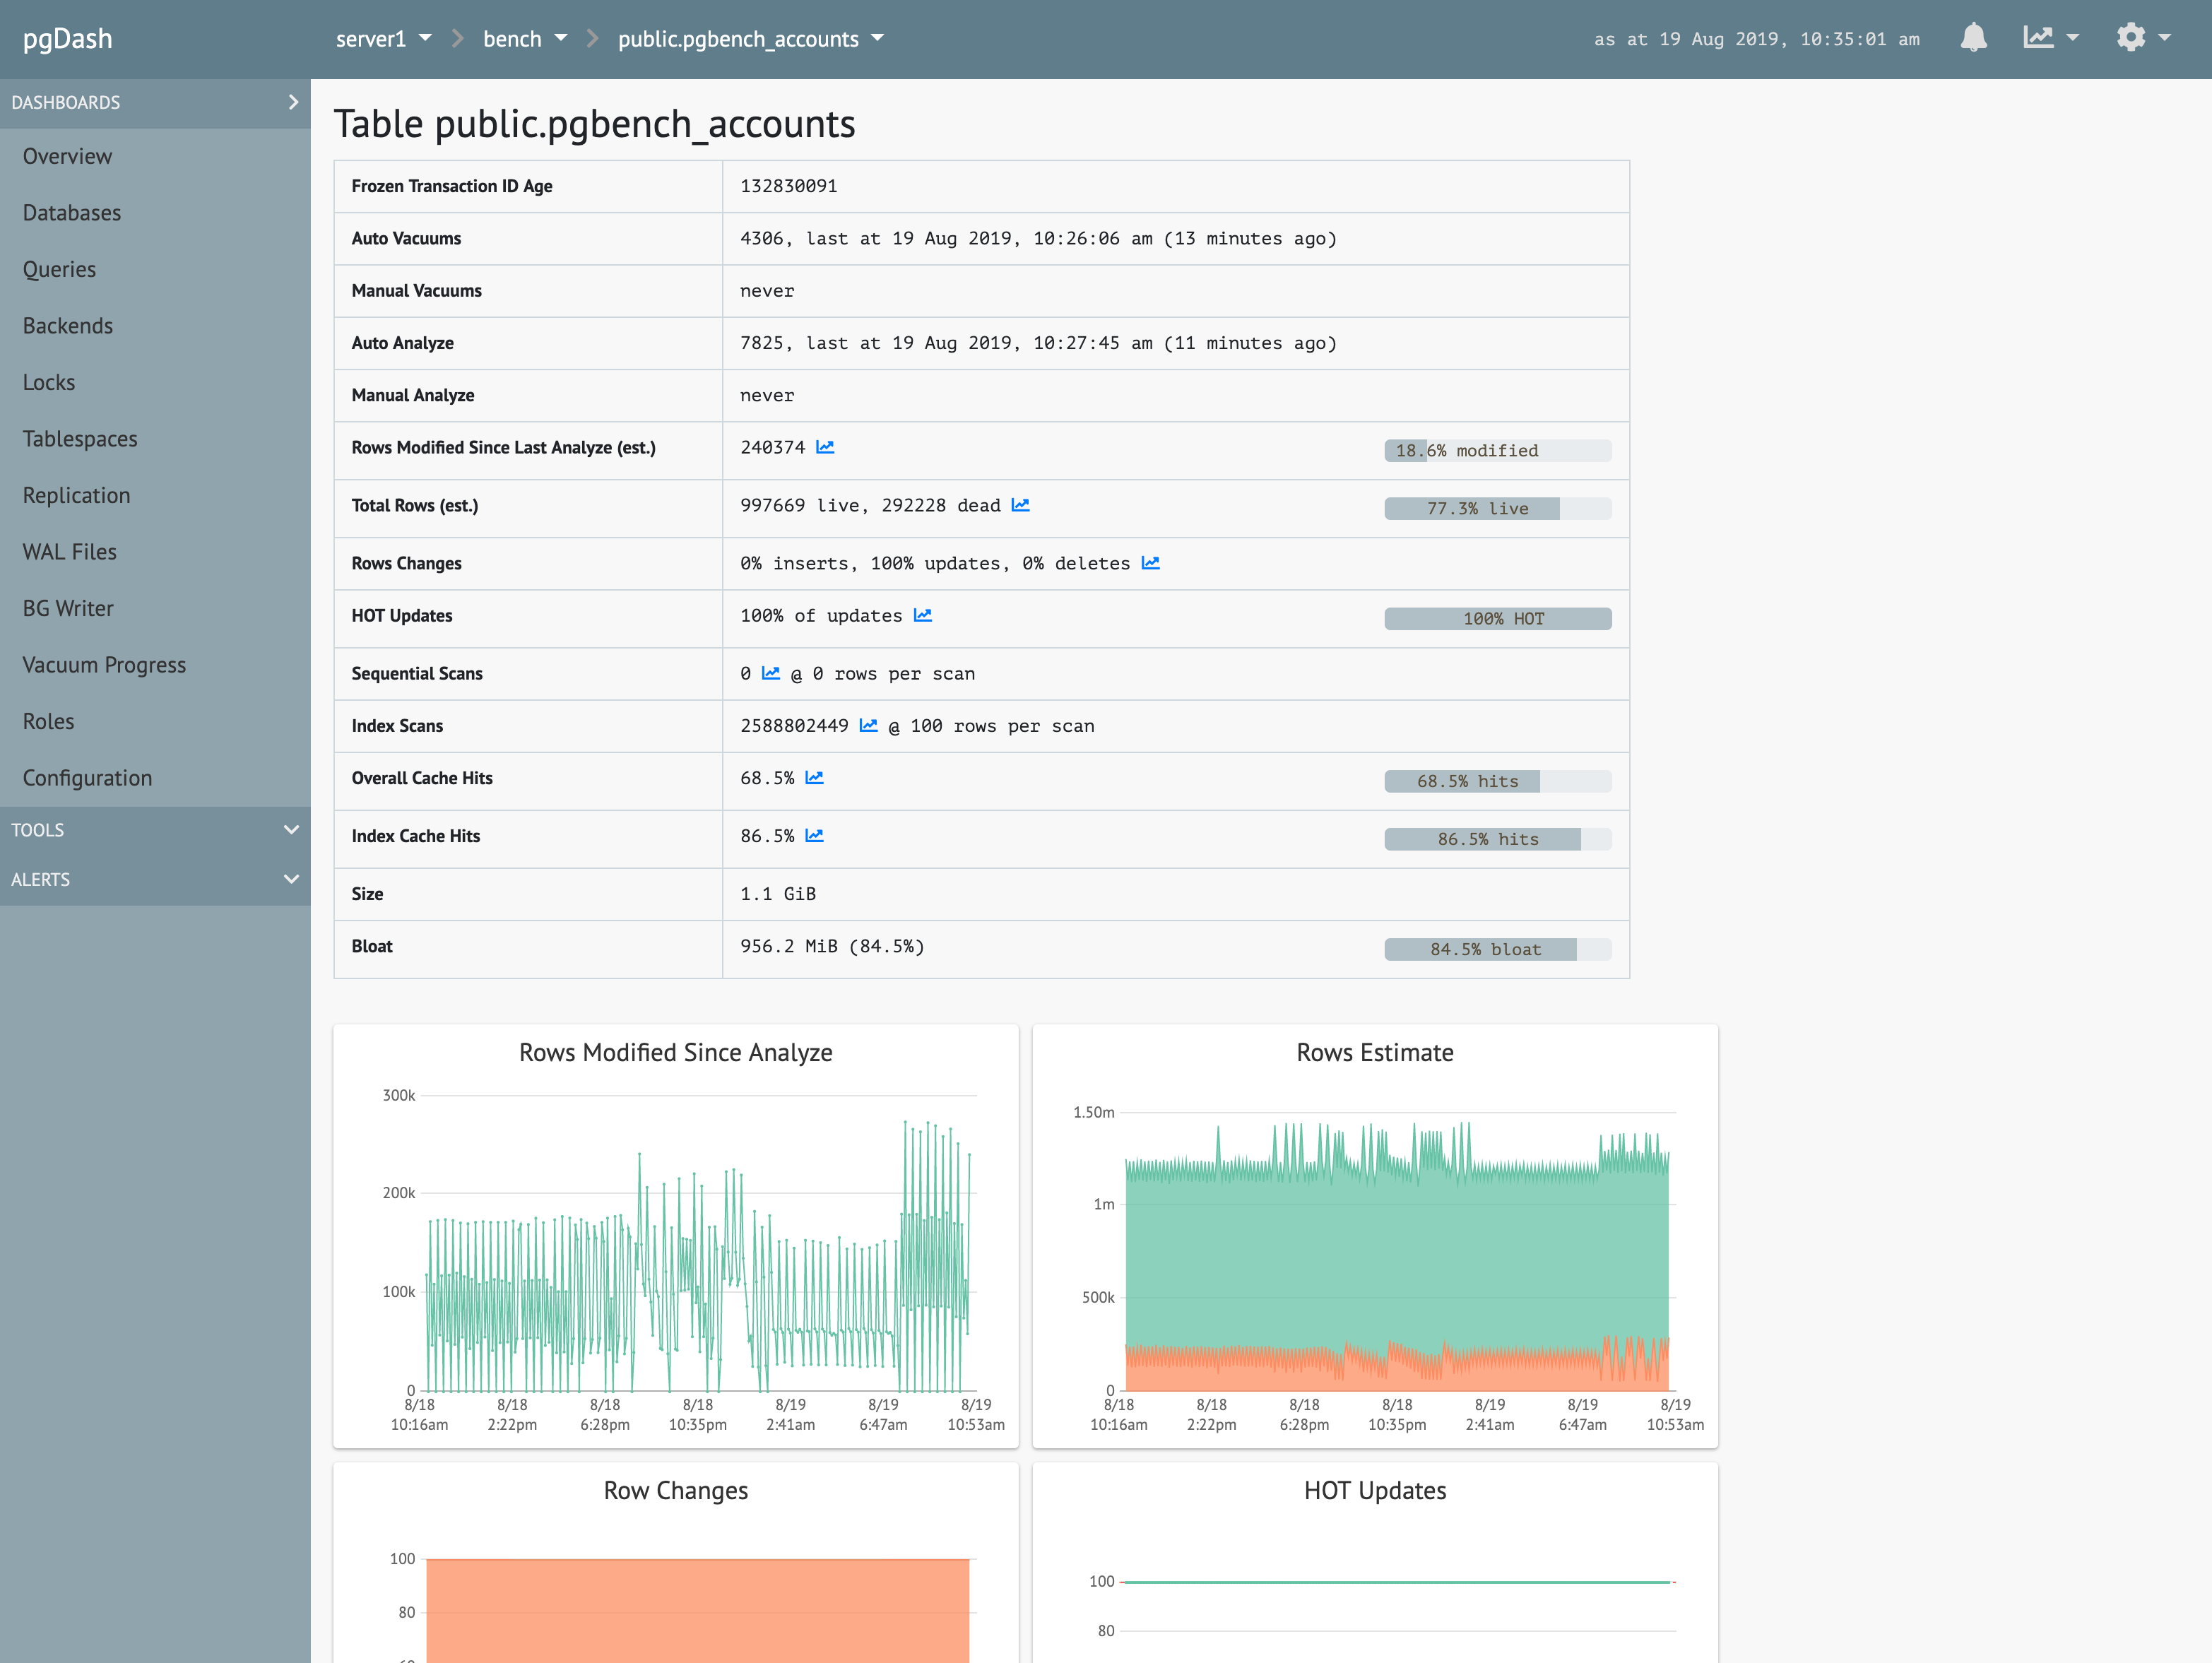
Queries
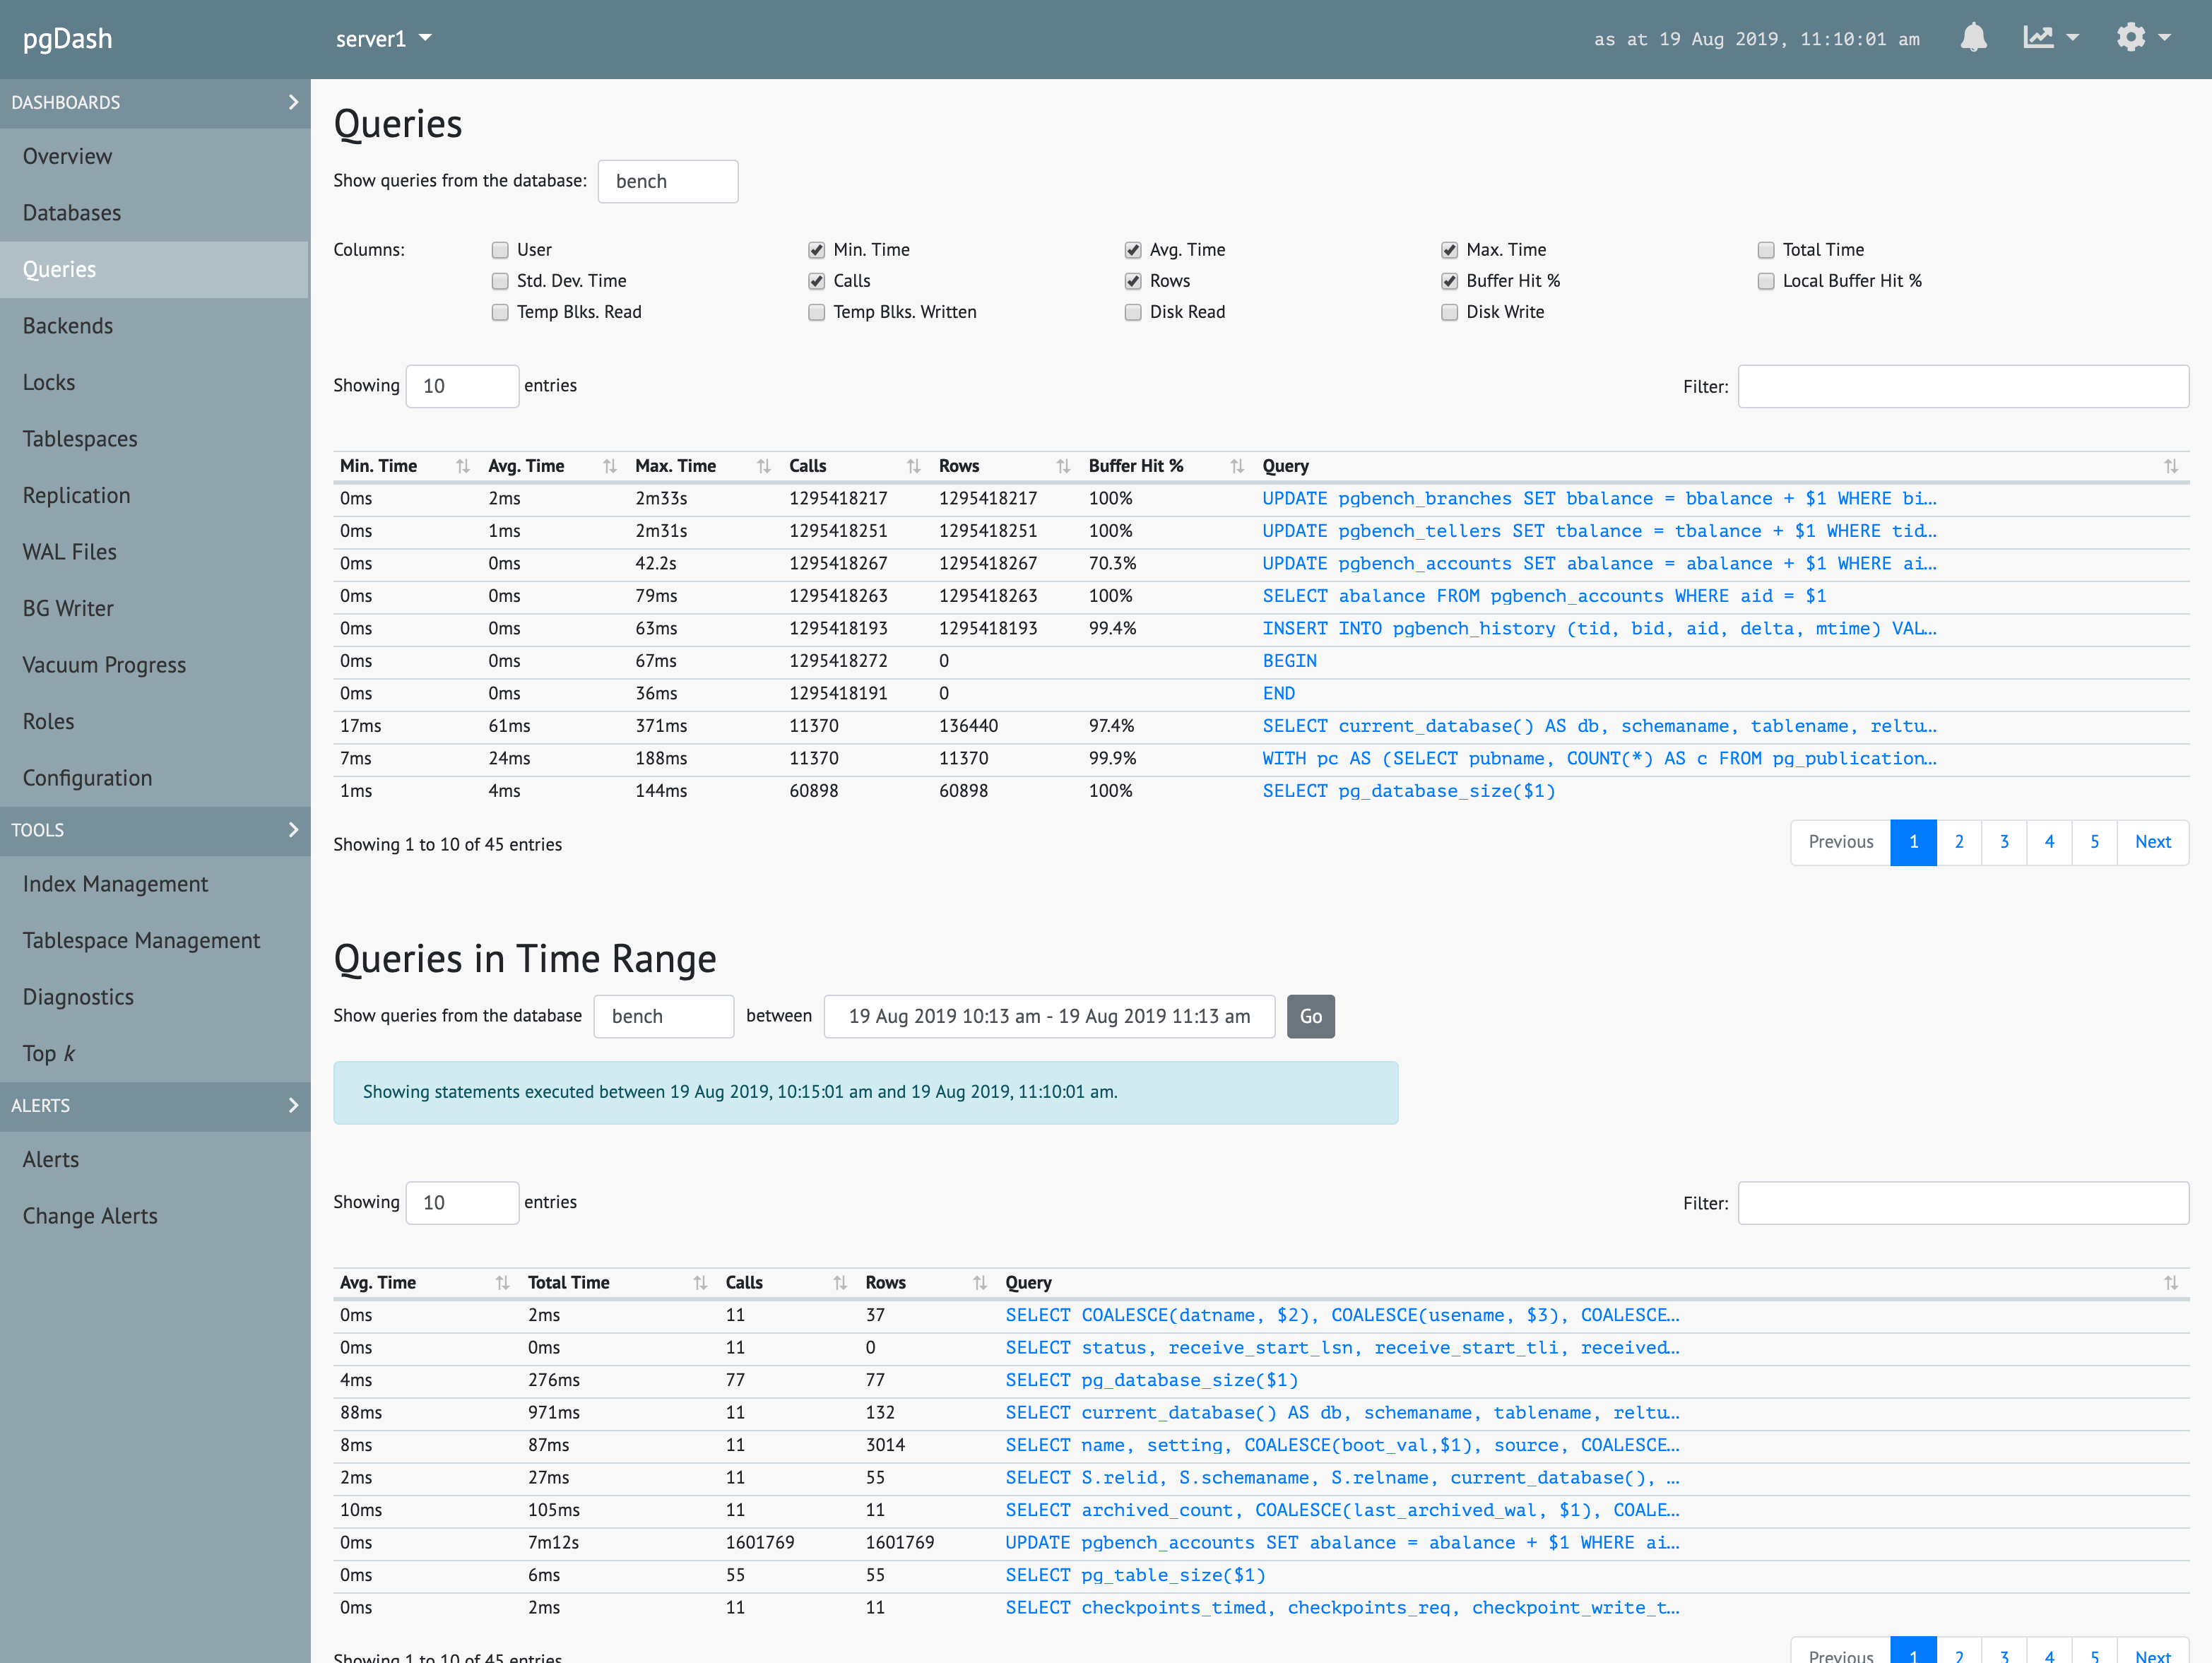
Extensive information about each SQL query executed, including time series graphs, execution plans with visualization, and suggestions to improve query performance.
Top k
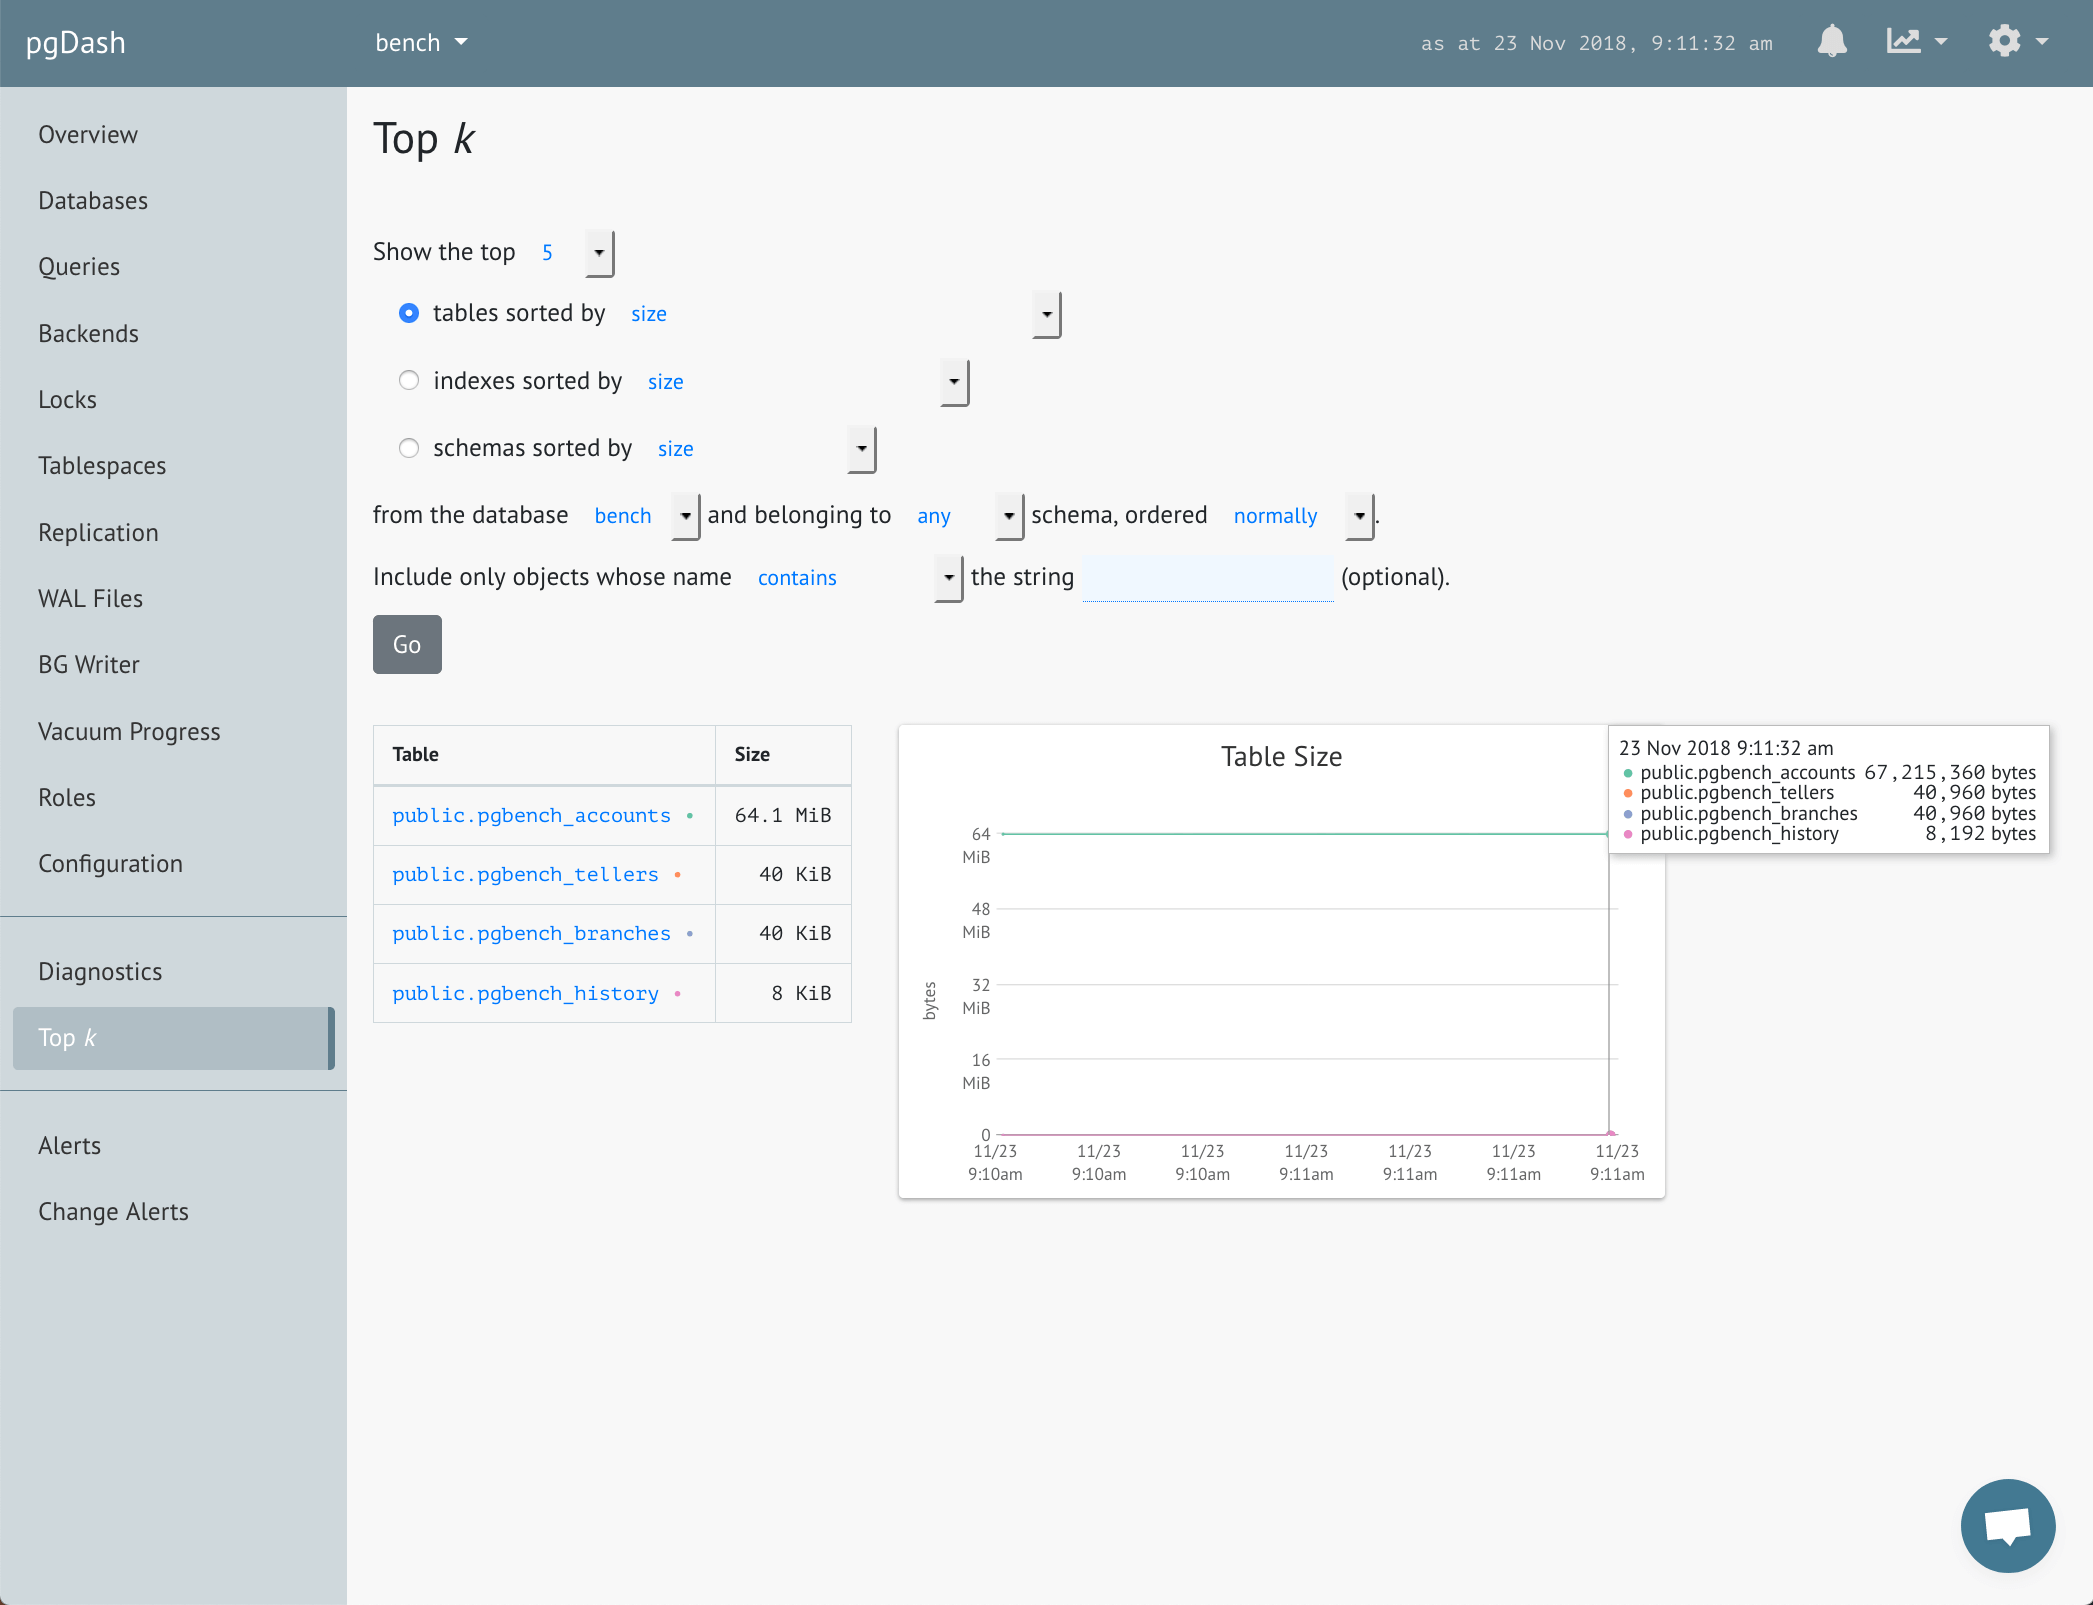
Identify the top tables, indexes or schemas, based on a number of criteria, like size, rows, growth, object counts and more.
Index Management
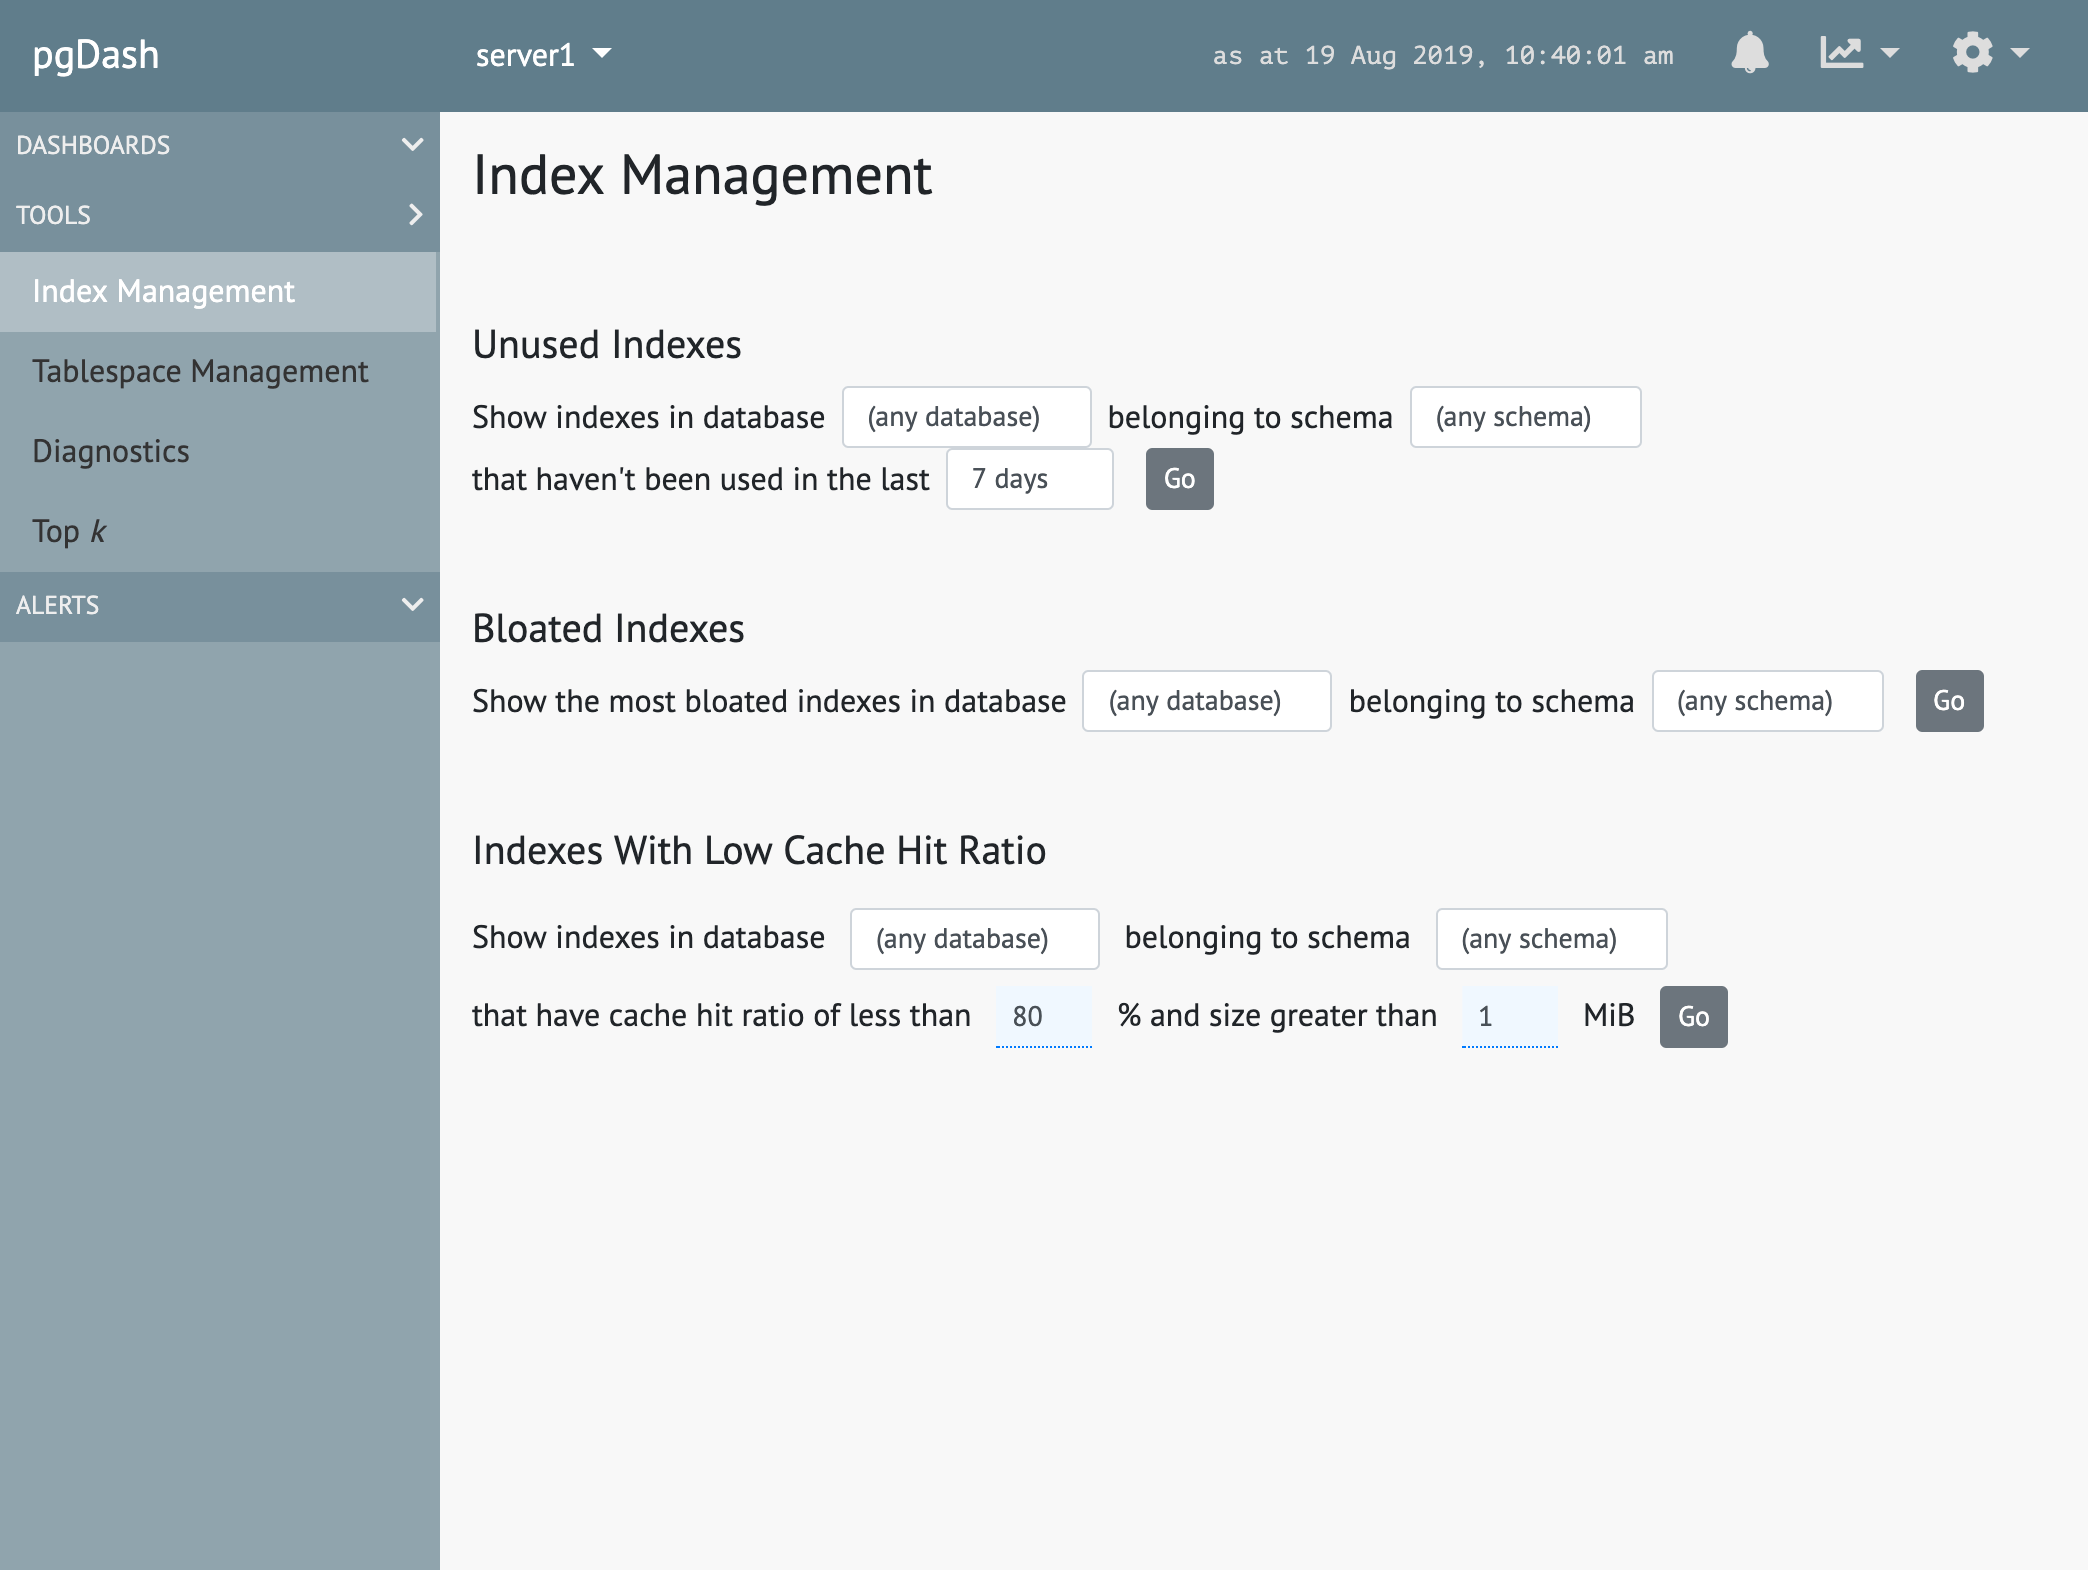
Find indexes that haven't been used recently, that are candidates for dropping. Identify indexes that are too bloated and need reindexing.
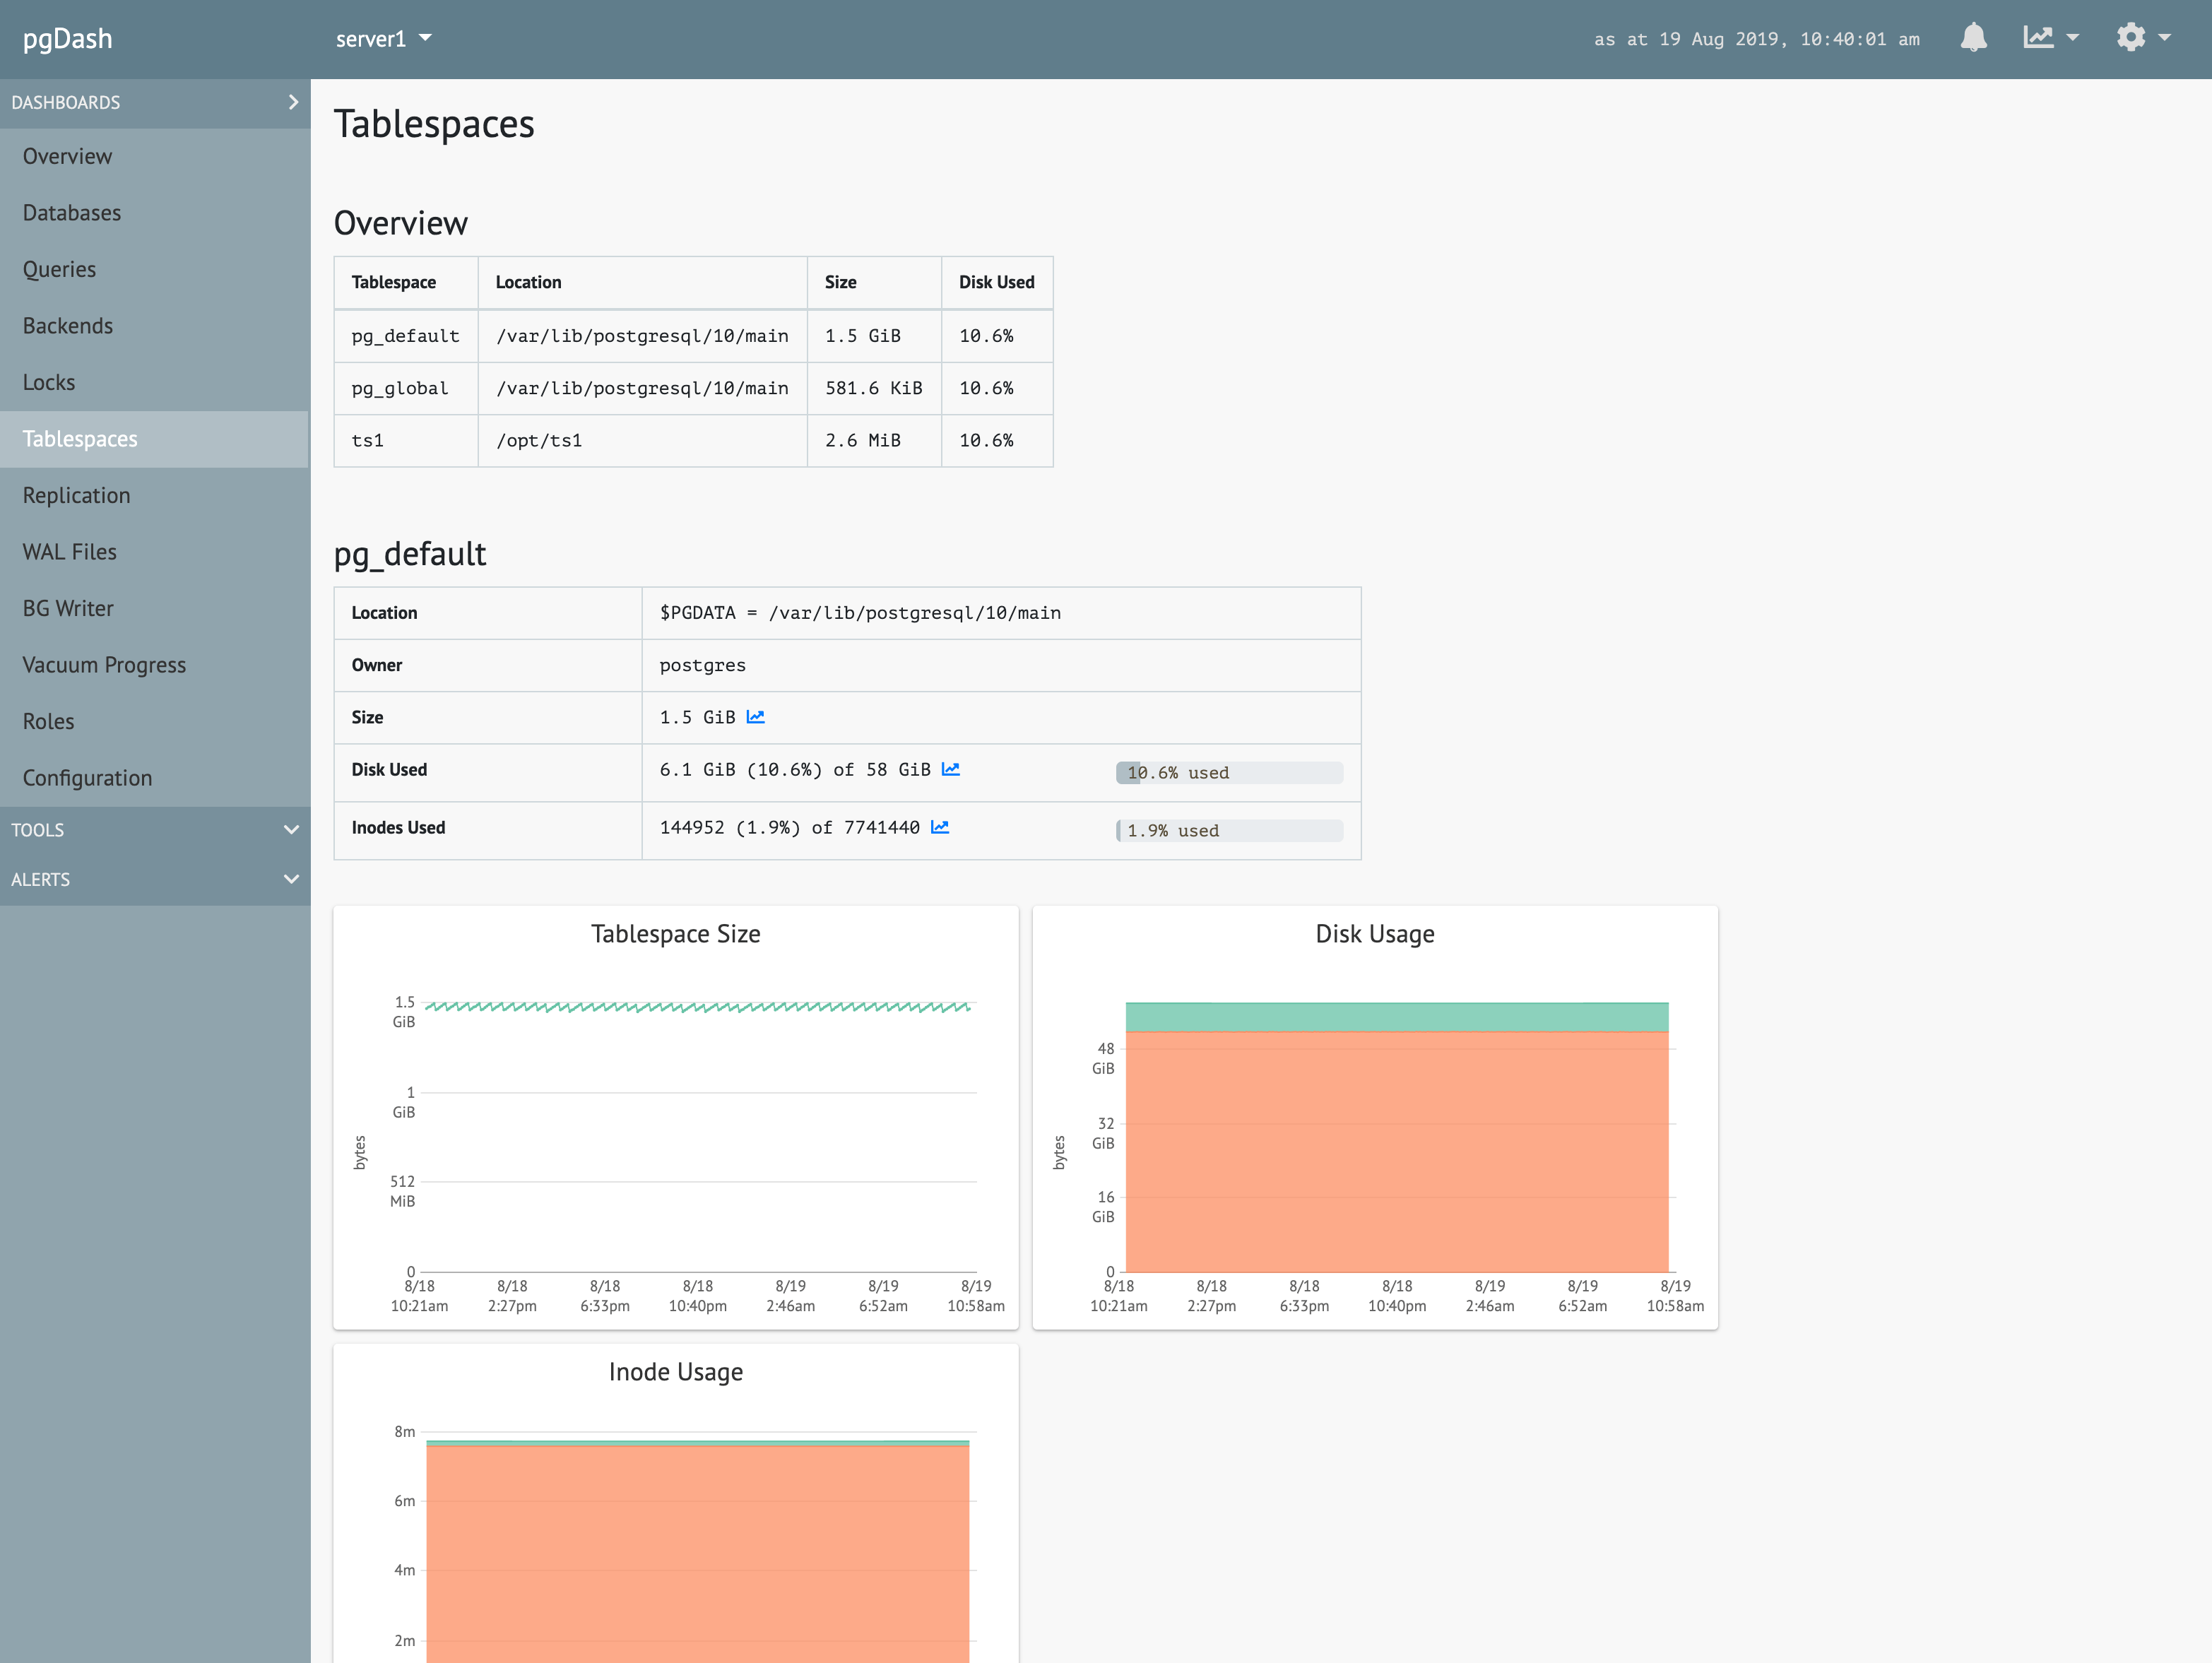
Tablespace Management
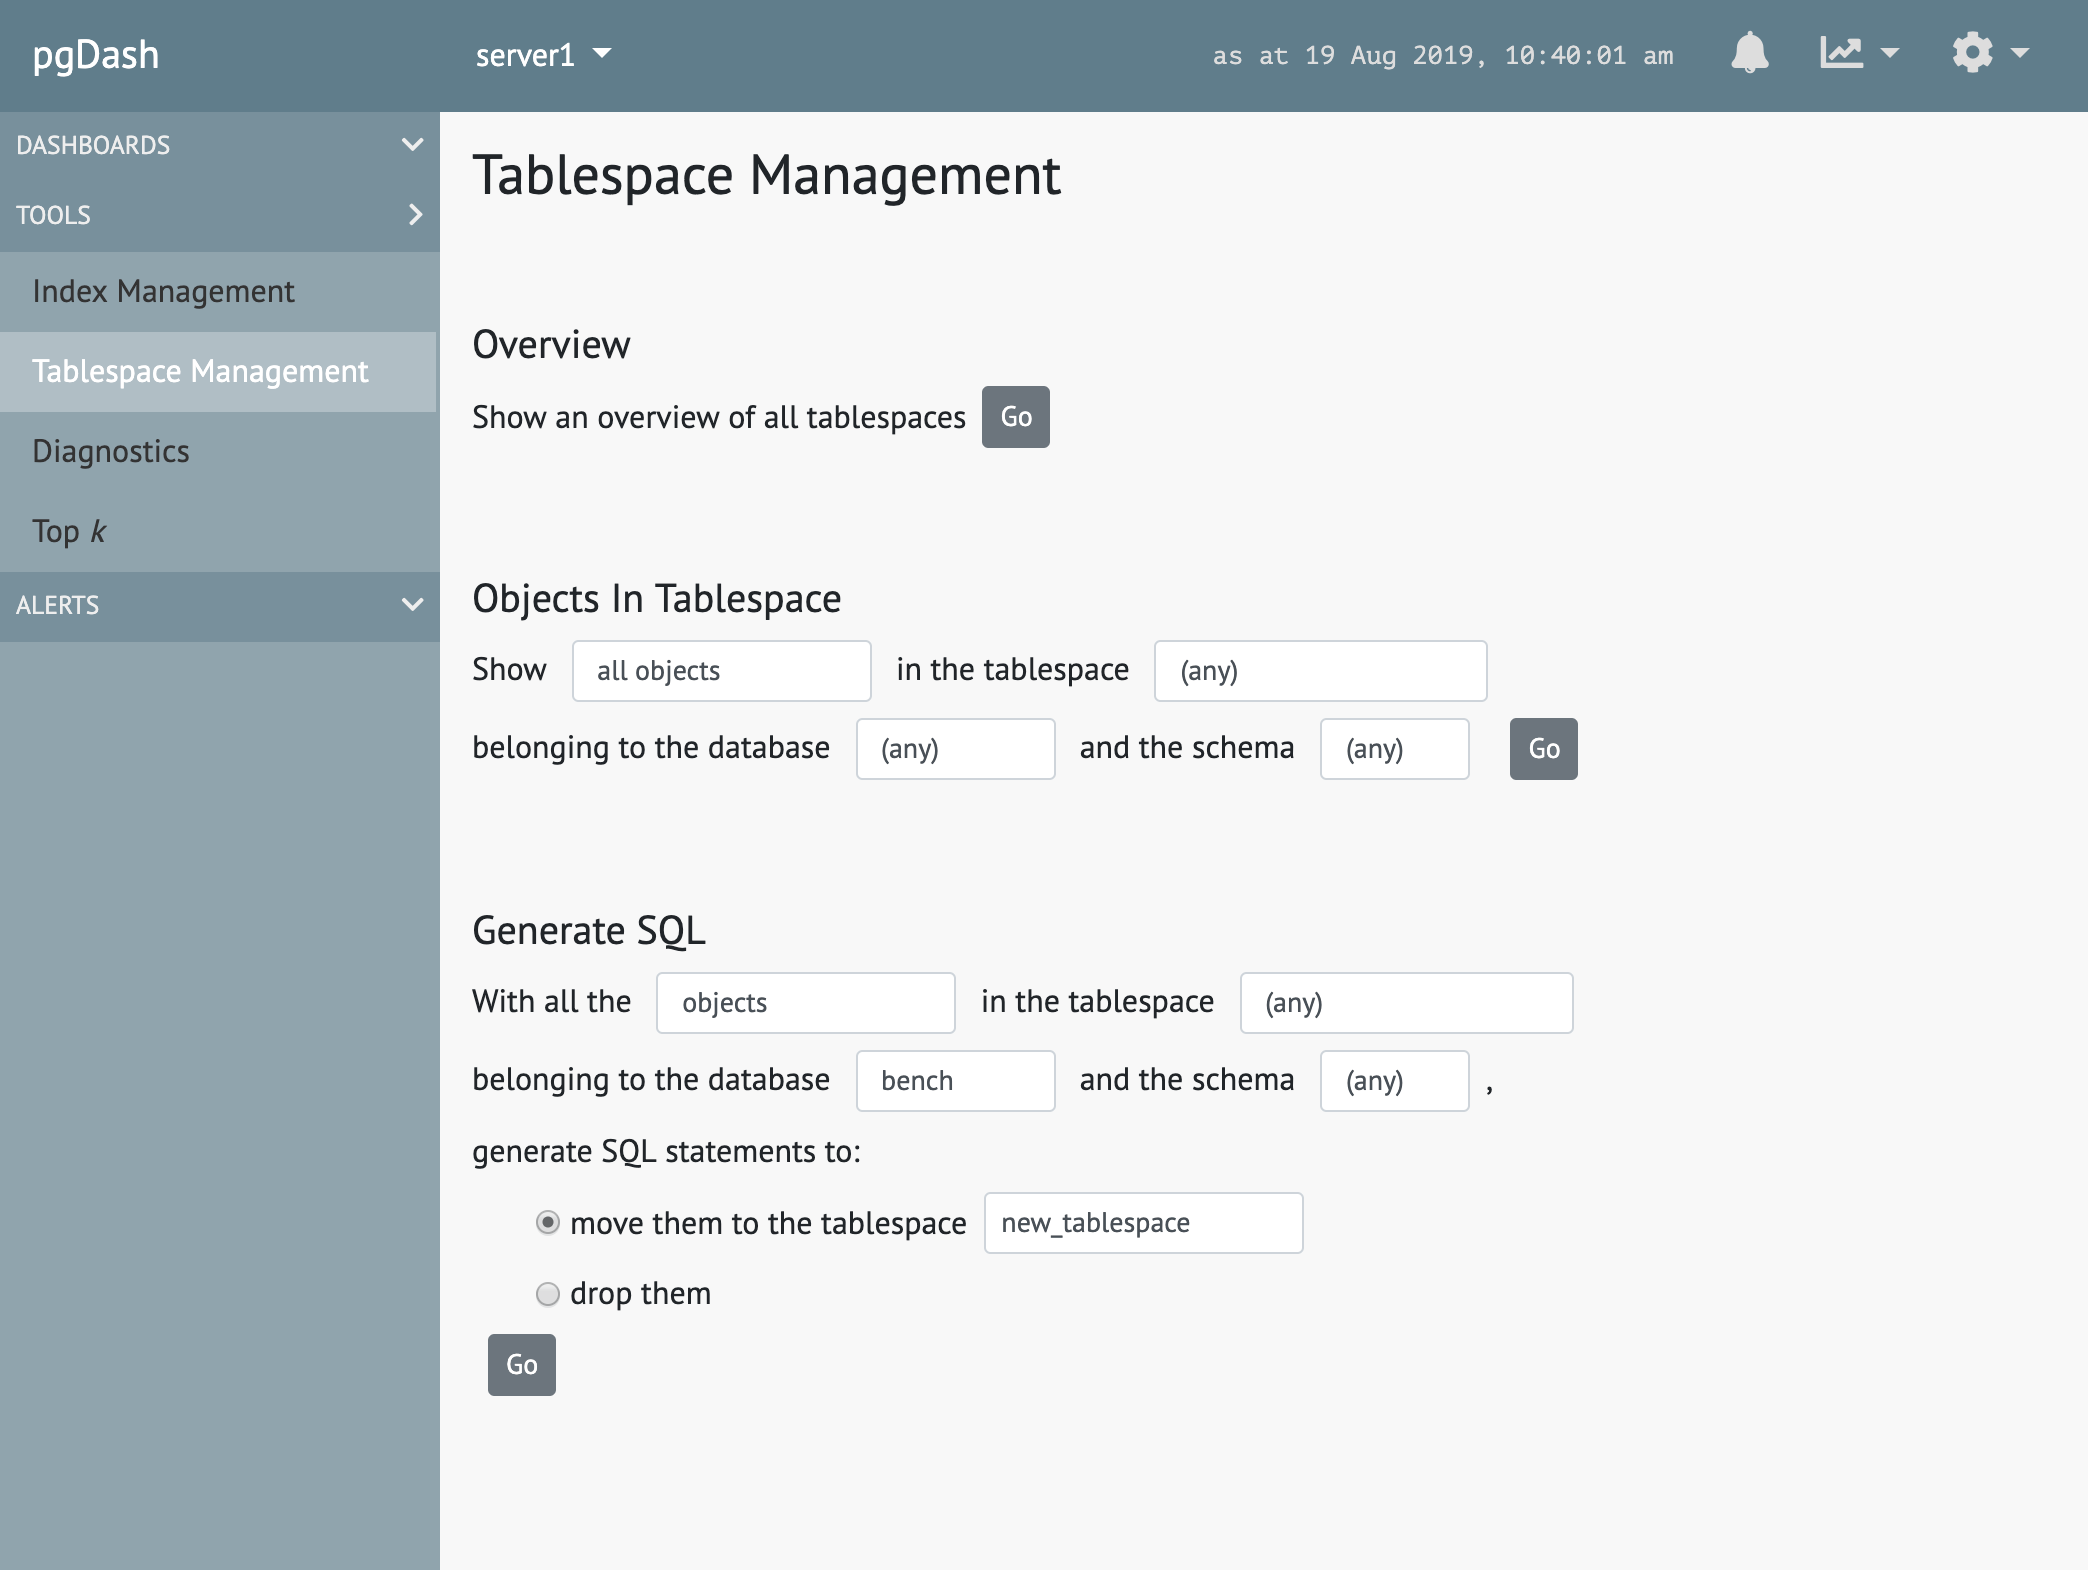
Figure out which objects in your tablespaces are taking up the most space and generate SQL statements to move them around or drop them.