pgDash is an in-depth monitoring solution designed specifically for PostgreSQL deployments. pgDash shows you information and metrics about every aspect of your PostgreSQL database server, collected using the open-source tool pgmetrics.
pgDash Alerts allows you to quickly set smart alerts for your database. Here is an overview the alerts that are available:
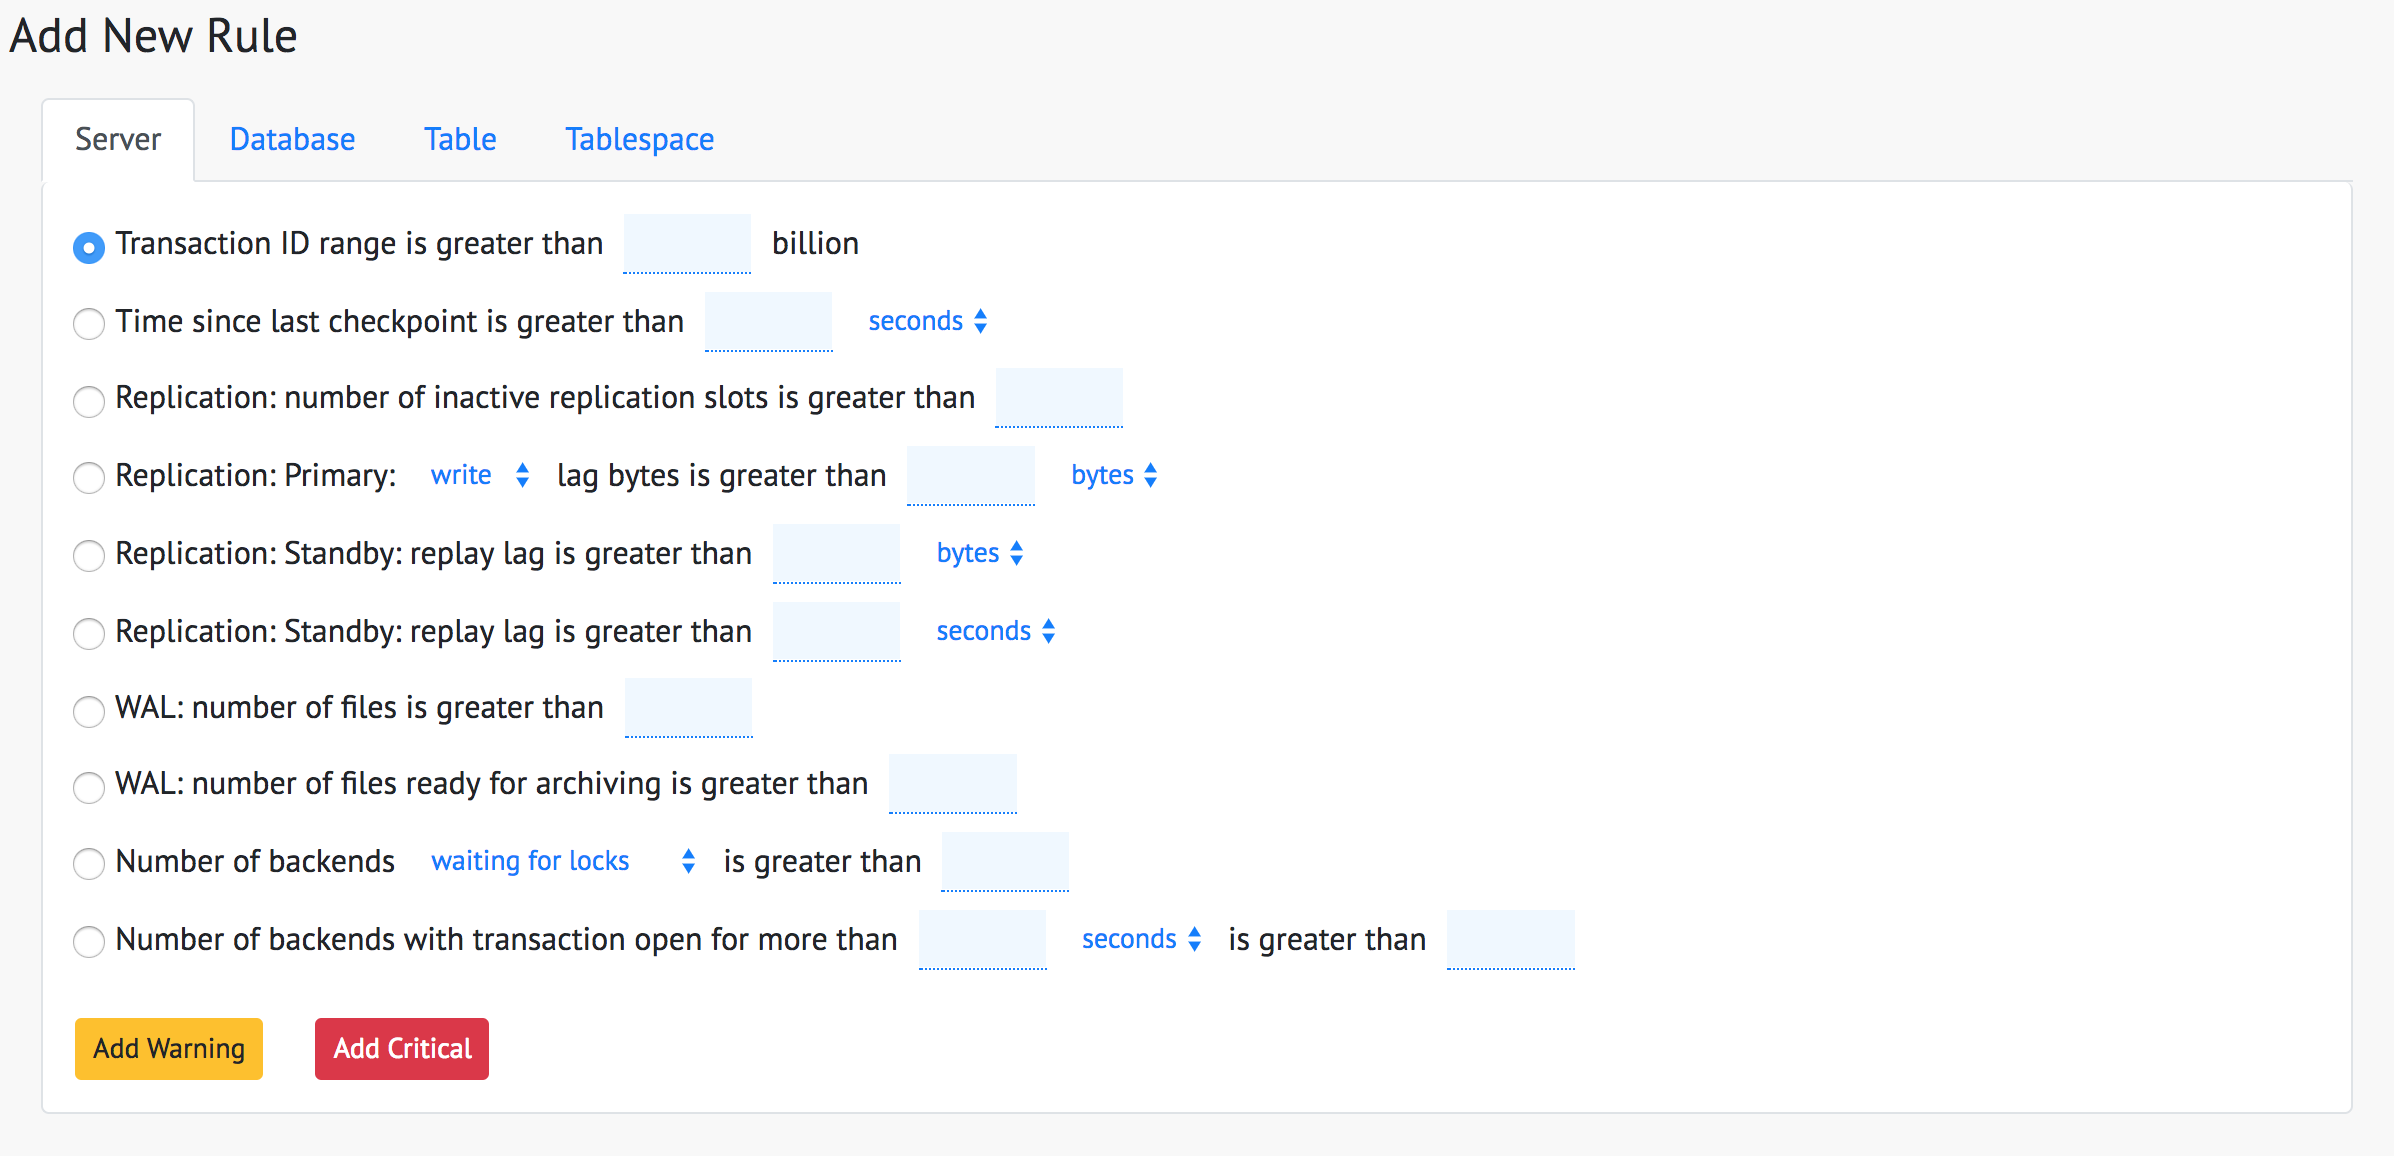
Server Level
At the server-level (or more correctly at the database cluster level), you can set alerts for:
- Transaction ID range getting closer to 2 billion
- Time since last checkpoint
- Replication: number of inactive replication slots
- Replication at primaries: write/flush/replay lag in bytes
- Replication at standbys: replay lag in units of bytes
- Replication at standbys: replay lag in units of time
- WAL files: number of wal files in pg_wal (earlier pg_xlog) directory
- WAL archiving: number of wal files ready for archiving
- Number of backends waiting for locks
- Number of backends idling in transaction
- Number of backends with transactions open for more than a certain time
Here is the UI to set server-level alerts. You can add the new rule either as a warning or a critical severity alert.
Database Level
At database-level, you can set these alerts:
- Number of backends, as an absolute number
- Number of backends, as a percentage of the maximum connections allowed to the database
- Commit ratio, as a percentage
- Transaction ID age (value of age(datfrozenxid)) as as a percentage of autovacuum_freeze_max_age setting (usually 2 billion)
- Database size
- Count of disabled triggers
- Cache hit ratio, as a percentage
You can choose which databases to apply the rule to. You can either apply the to rule to all databases, or restrict to databases whose name contains/does not contain/starts with/ends with/is exactly a certain text.
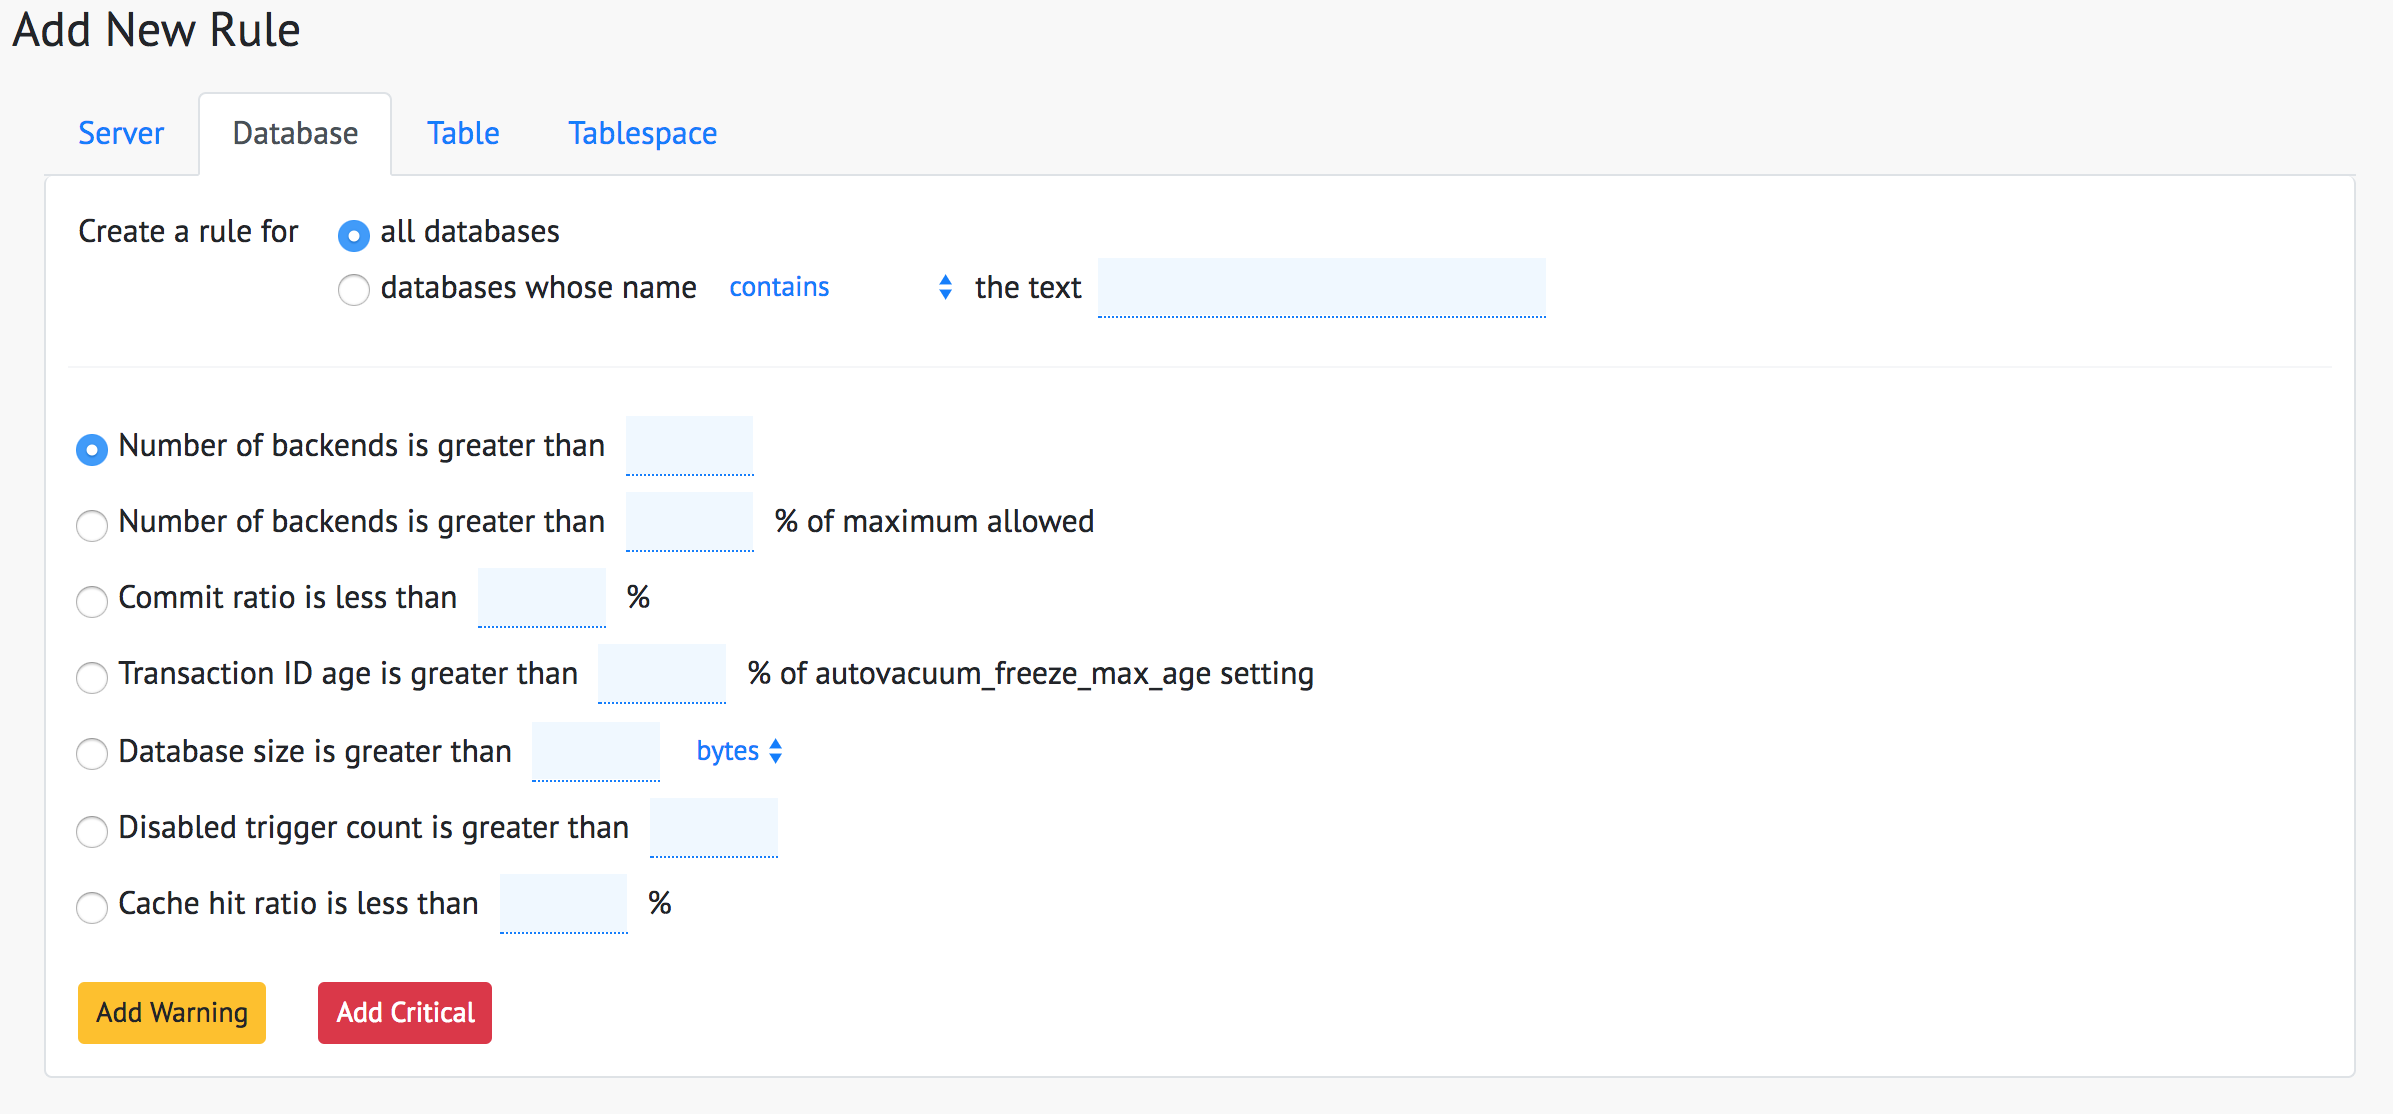
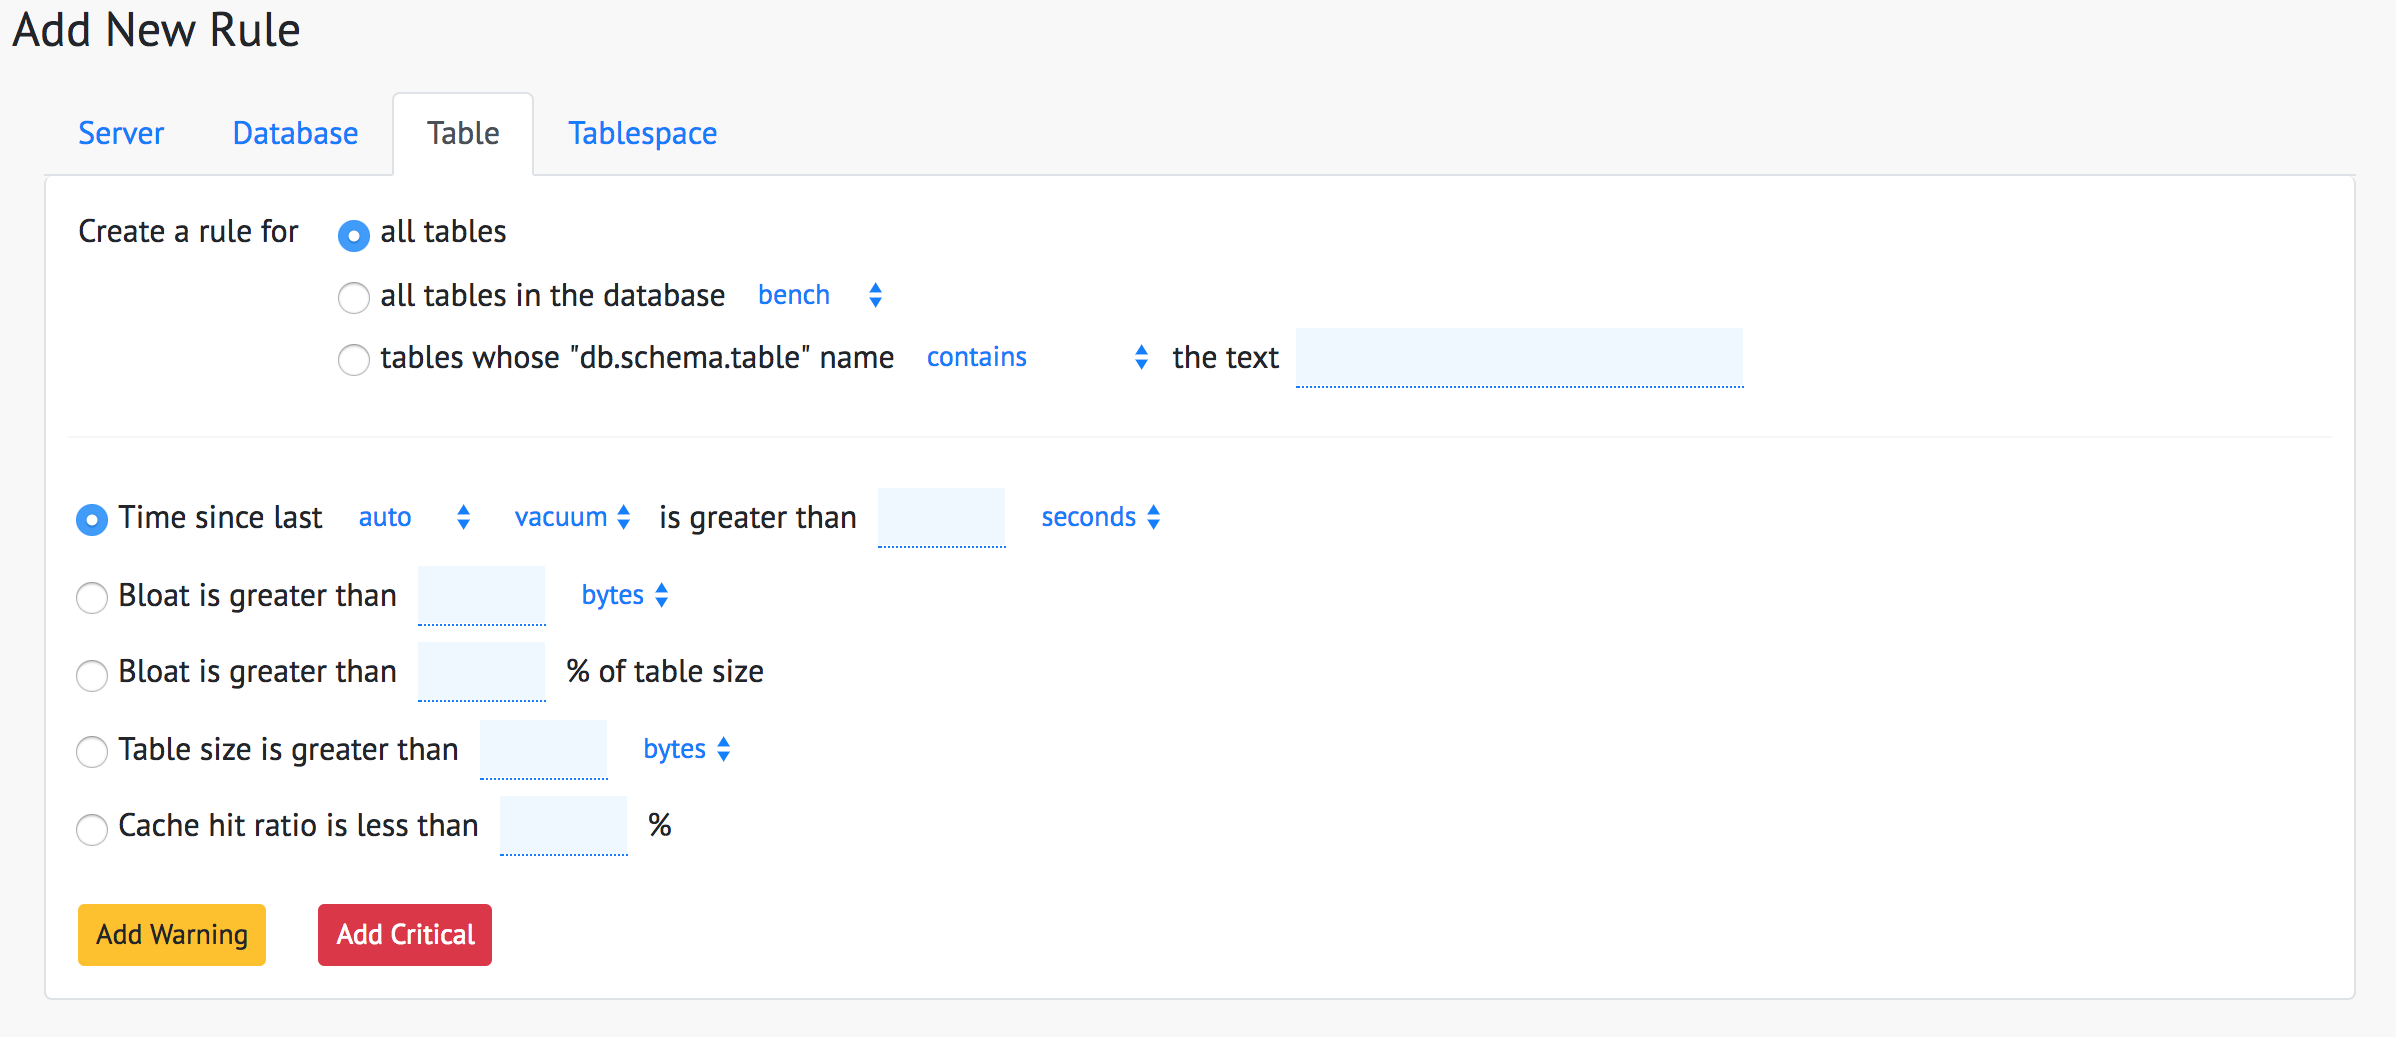
Table Level
Table-level alerts include size and bloat. The full list is:
- The time since the last auto/manual vacuum/analyze happened
- The size of the table in units of bytes
- The bloat, in units of bytes
- The bloat, as a percentage of the table size
The tables the rule applies to can be chosen like with database-level rules. Additionally, you can also restrict the rule to all the tables within a certain database.
Tablespace Level
Disk space rules are set at the tablespace level.
- The size of the tablespace, in units of bytes.
- The free disk space, as a percentage of the total disk space.
- The free inode count, as a percentage of the total available inode count.

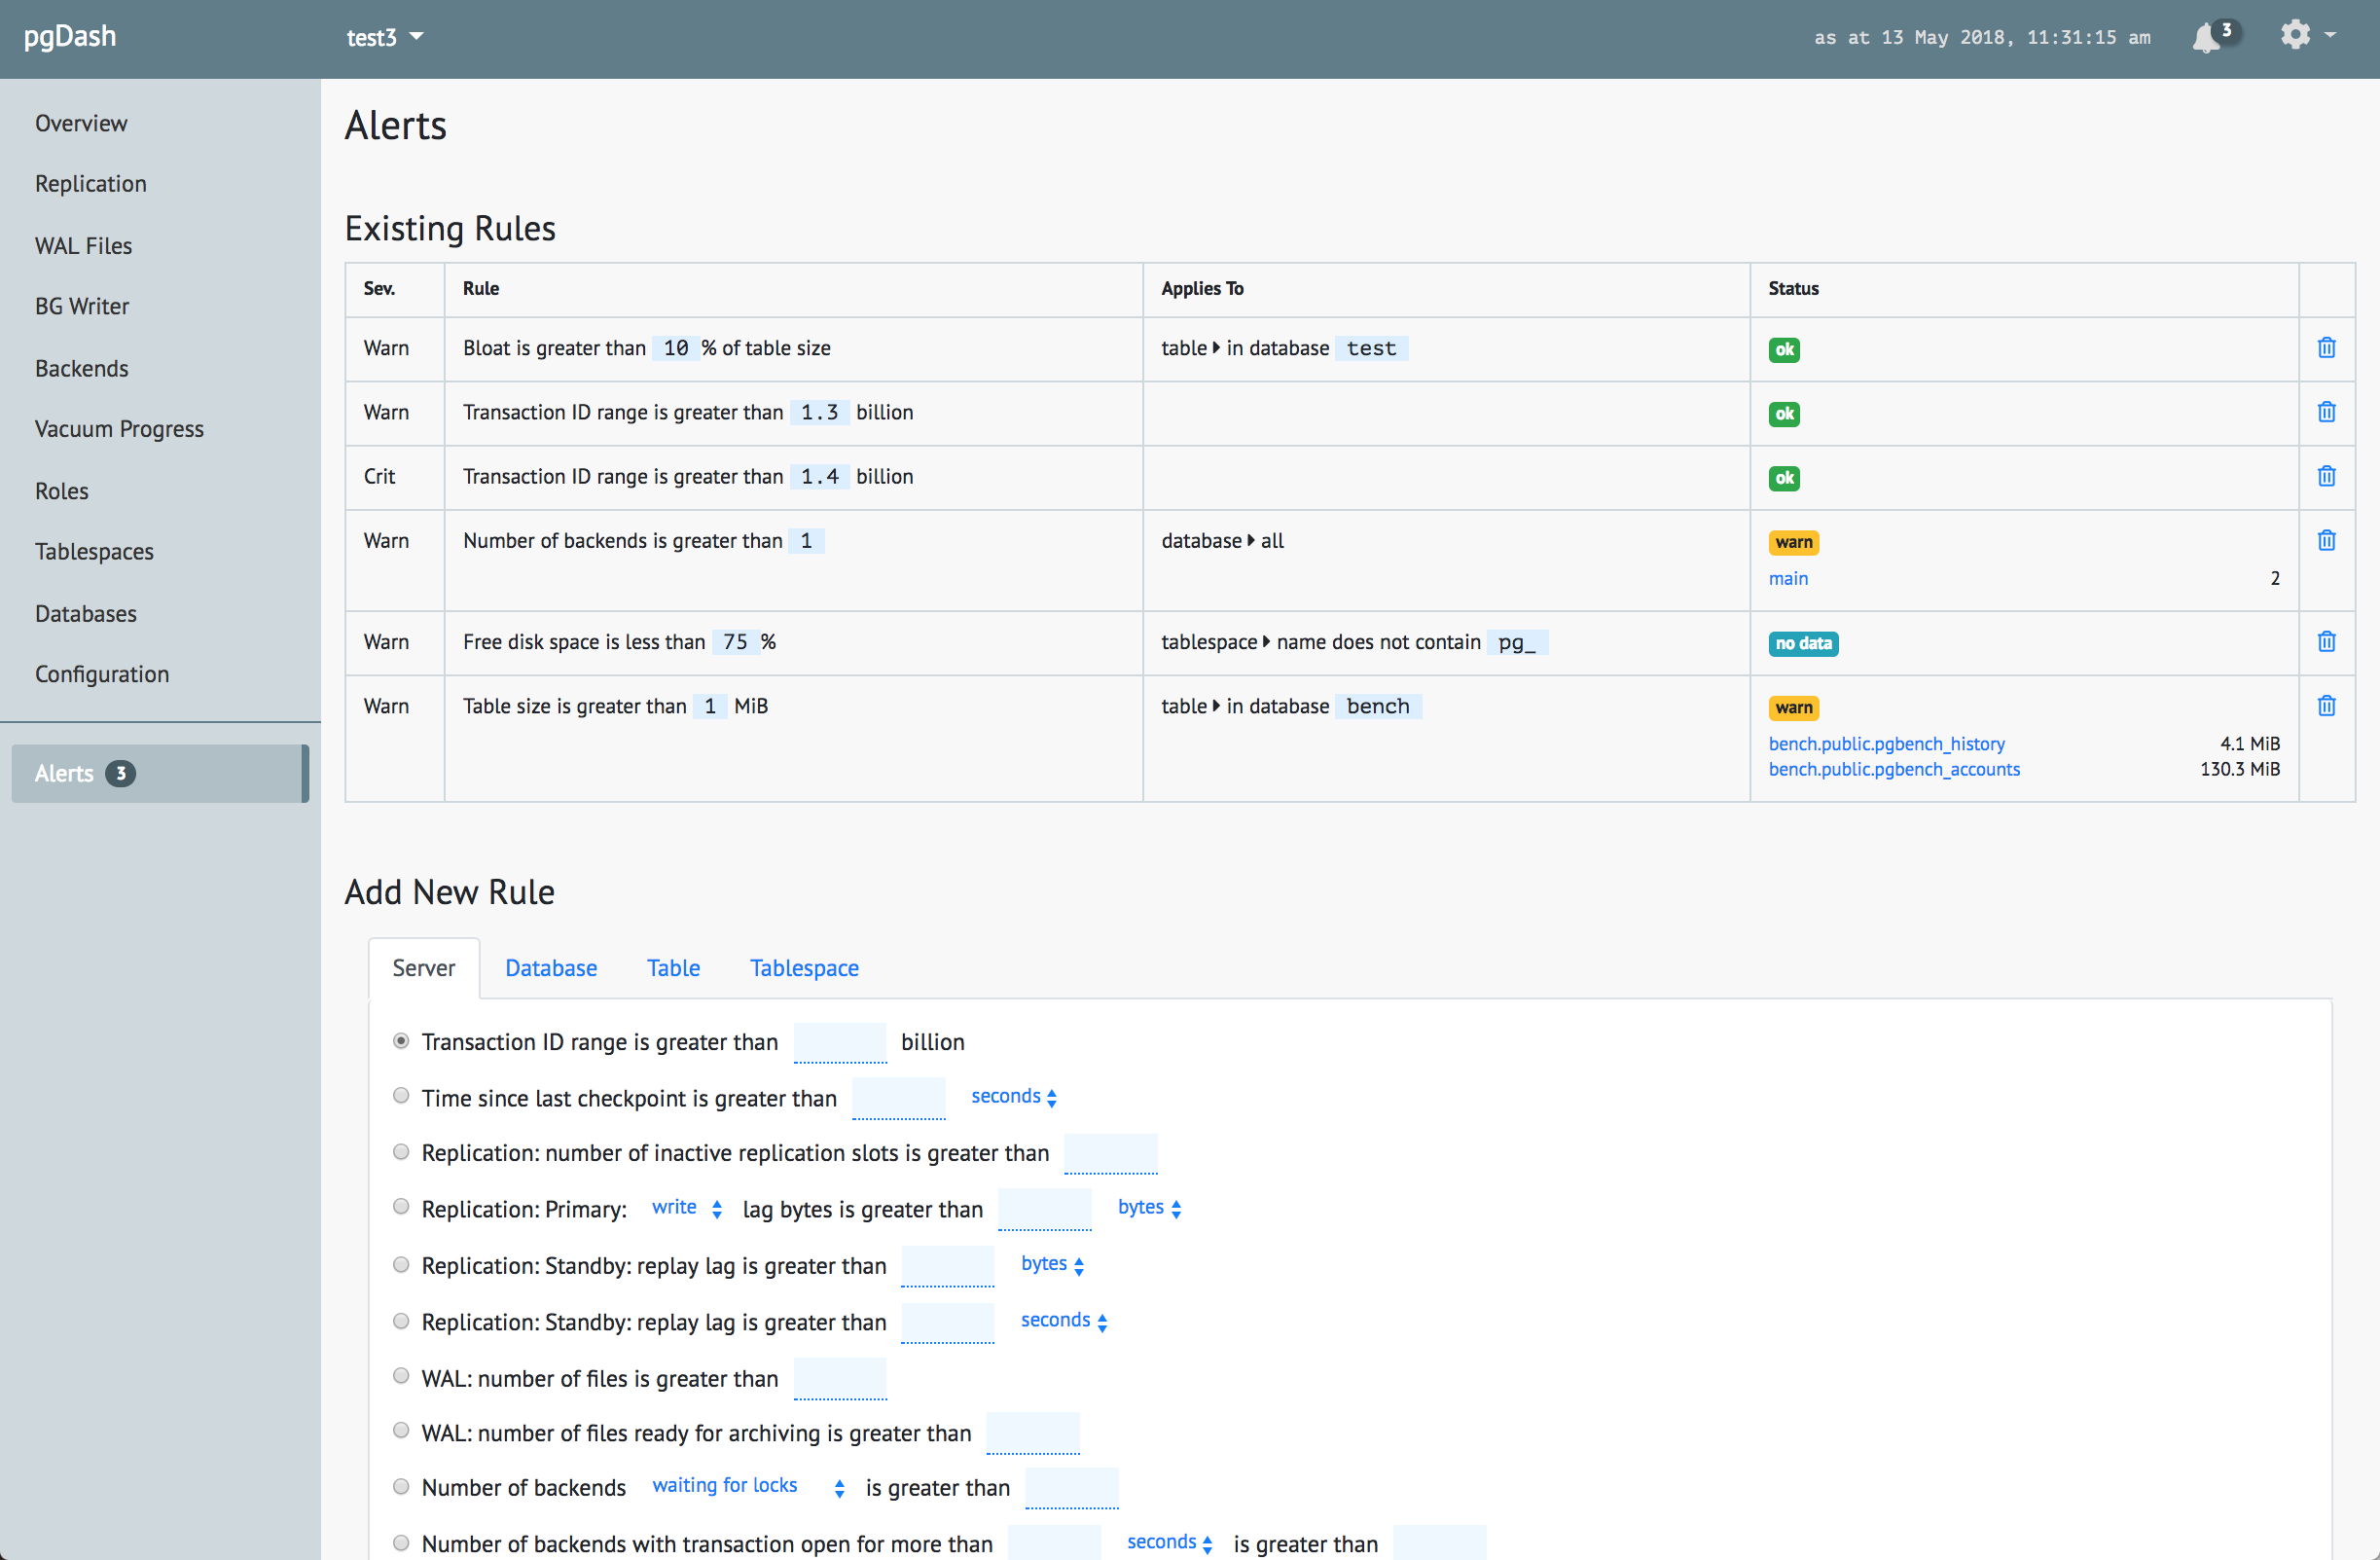
Alerting Status
Alerting rules are evaluated whenever you send in a pgmetrics report. These are displayed in the UI, and can also be sent out as email notifications. Here is the full UI, with a few triggered alerts:
Notifications
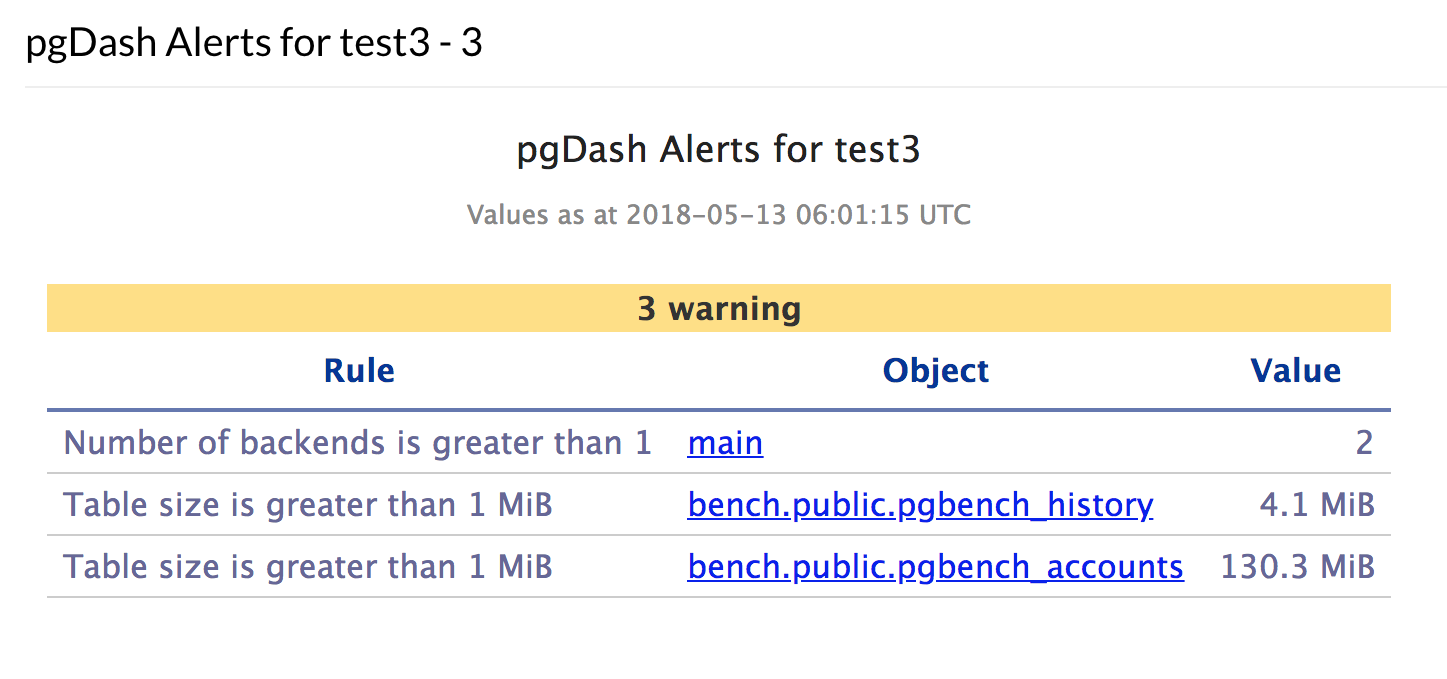
Alerts can be notified via email, to one or more email addresses. They can also be sent out to Slack channels. PagerDuty events can also be triggered. Here is a what an email looks like:
What did we miss?
pgDash intends to be the fastest and smartest way for DBAs to keep an eye on their databases. We’d be excited to hear what you think of our effort so far! What else can we do? What can we do better? Let us know at hello@rapidloop.com, via the contact page or chat with us using the chat widget.