A little care and grooming of your PostgreSQL deployment goes a long way in ensuring performance, avoiding unpleasant discoveries and establishing confident predictability. Here are 7 things that you should keep an eye on.
Table Bloat
PostgreSQL implements transactions using a technique called MVCC. MVCC is too long and involved a topic to discuss in detail, but there are three things you must know about it:
- Deleting a row only marks it as “invisible” to future transactions.
- Updating a row creates a new version of the row. The old version is marked invisible to future transactions, and the new version is marked as visible.
- Periodically, someone needs to look at all the currently running transactions and say: OK, the oldest transaction here is #42, so every row version that is invisible to #42 can be physically deleted without hurting data consistency.
That is how MVCC works (essentially), and the implication is that updates will increase your physical database storage footprint, and deletes will not reduce it. MVCC sounds like a lazy way to do things, but it is popular because it provides both consistency and performance.
The unwanted, obsolete row versions in a table are called bloat (or dead rows). The process that can clear out bloat is called vacuum. PostgreSQL has an automatically triggered vacuum process with tunable thresholds called autovacuum, and of course the VACUUM command.
In general, bloat can also slow down queries because of inaccurate visibility maps and wasted disk I/O.
Because of this, you should regularly:
- monitor the amount of bloat in a database
- run vacuum regularly
- monitor if vacuum is being run regularly for all tables
There are a few SQL queries to provide a per-table bloat estimates. The open source tool pgmetrics provides bloat estimates as well as last run times of manual and automatic vacuum.
Index Bloat
Indexes can bloat too. Although the internal structure of indexes are opaque to the SQL user and vary by the index type (BTree, hash, GIN, GIST, etc.), the general idea remains that when rows referred to by the index are deleted, the space occupied by the related information inside the index is only logically deleted and not released back to the filesystem. The logically deleted space can be reused by the index later on.
There are two ways to get Postgres to shrink the physical size of an index:
- the FULL version of the VACUUM command
- REINDEX
Index bloat must be monitored, so that you are at least aware of the amount of space remaining unused. In tables with high row churn it is not uncommon to setup regular index rebuild jobs.
Index bloat can also be obtained by the same queries as before, and also via pgmetrics.
Long Running Transactions
Transactions should be kept as short as possible, especially in an MVCC system.
Imagine that a transaction started yesterday and there was a vacuum run just after that. Now for as long as this transaction is open, further vacuums are useless, since by definition our transaction will need to see all the rows of all the tables as they were when our transaction began yesterday. Even if our transaction is read-only, this is still the case.
As a result, long running transactions create bloat. They also hang on to system resources, hold unrelinquished locks and increase chances of deadlocks.
The best way to keep an eye out for long running transactions is to set up
an alert for the number of transactions that have been running for more than
a certain duration. You can get this from the statistics view
pg_stat_activity, like so:
-- number of transactions that have been open for
-- more than 1 hour
SELECT count(*) FROM pg_stat_activity WHERE xact_start < now()-'1 hour'::interval;
Replication Lag
When streaming replication is used to replicate all changes from a primary PostgreSQL server to a hot standby (aka read replica), there is a usually a slight delay between the time when row updates happen on the primary and when the changes are visible to applications connected to the standby.
There are however, cases when this lag can increase:
- the standby system is unable to receive and apply the changes from the primary fast enough to keep up with it, usually because of high load or underprovisioning
- a degraded network or disk
- query conflicts
A standby with a high or even worse, increasing, replication lag can result in queries on the standby returning stale data, and a standby that is unfit for failover.
If you have a streaming replication setup, monitoring of replication lags between each primary-standby pair is very important, and you’ll want to set up alerts to check if replication lags exceed a minute, or whatever threshold makes sense for your setup.
This post has a lot more about how to measure and monitor replication lag from both primary and standby ends.
Inactive Replication Slots
The use of replication slots, introduced in PostgreSQL 9.4, makes streaming replication more robust and efficient. Essentially, the standby reports it’s replication progress to the primary, which stores this information in the “replication slot”.
Because of this, the primary now knows at all times how far behind the standby is. This allows the primary to retain a sufficient backlog of WAL files (which are needed to resume replication) when the standby goes offline. Thus when the standby comes back, even after a long time, the primary can still guarantee that the replication can be resumed.
Prior to replication slots, the primary may clean up old WAL files, as it had no way of knowing if it’s standbys needed them or not. If a WAL file needed by a standby is deleted, there is no way to resume the replication; it has to be setup again from scratch.
However, the primary’s behavior of retaining WAL files indefinitely leads to
another problem. If a standby was retired and the associated replication slot
was not deleted, WAL files will be retained forever. WAL files retained for
this reason are not subject to the limits set by max_wal_size and other
configuration options.
This situation will persist until WAL files eat up the whole disk space, with not even a warning in the PostgreSQL log files.
Needless to say, inactive replication slots must be dealt with when they are detected. Find your inactive replication slots using:
SELECT slot_name FROM pg_replication_slots WHERE NOT active;Analyze Status
ANALYZE is run on tables to collect and update statistical information about the contents of the table. This information is used by the query planner to prepare the execution plan for every SQL query. Up-to-date stats about the table contents results in a better execution plan, which in turn results in a faster query.
The autovacuum daemon usually runs ANALYZE after VACUUM. This may not be frequent enough for ANALYZE however. If the distribution of the data in a table changes often, you should be running ANALYZE more frequently.
Typically ANALYZE is quite well behaved – it needs only read locks, does not use up too much of any resource and completes in reasonable time. It is safe to err on the side of running it more often than not.
Keeping an eye out for tables that haven’t been ANALYZEd in a while is a good idea. Find out the last time your tables were (auto-)analyzed with the query:
SELECT schemaname || '.' || relname, last_analyze, last_autoanalyze
  FROM pg_stat_user_tables;
Resource Usage
Monitoring the CPU load, memory and disk usage goes a long way in ensuring you’ll have enough capacity on hand to meet the growing needs of the applications using your database.
PostgreSQL spawns one process to handle one connection. While this may not the most scalable architecture nowadays, it does contribute a lot on the stability front. It also makes the OS load average more meaningful. As usually PostgreSQL boxes run only PostgreSQL, a load average of say 3 typically means there are 3 connections waiting for CPU cores to become available to that they can be scheduled. Monitoring your maximum load average during a typical day or week can give an estimate of how over- or under-provisioned your box is on the CPU front.
Memory and free disk space are of course standard things to monitor. More connections and longer running transactions place higer demands on memory. And while monitoring disk free space, remember to track it per tablespace.
About pgDash
pgDash is a modern, in-depth monitoring solution designed specifically for PostgreSQL deployments. pgDash shows you information and metrics about every aspect of your PostgreSQL database server, collected using the open-source tool pgmetrics. pgDash provides core reporting and visualization functionality, including collecting and displaying PostgreSQL information and providing time-series graphs, detailed reports, alerting, teams and more.
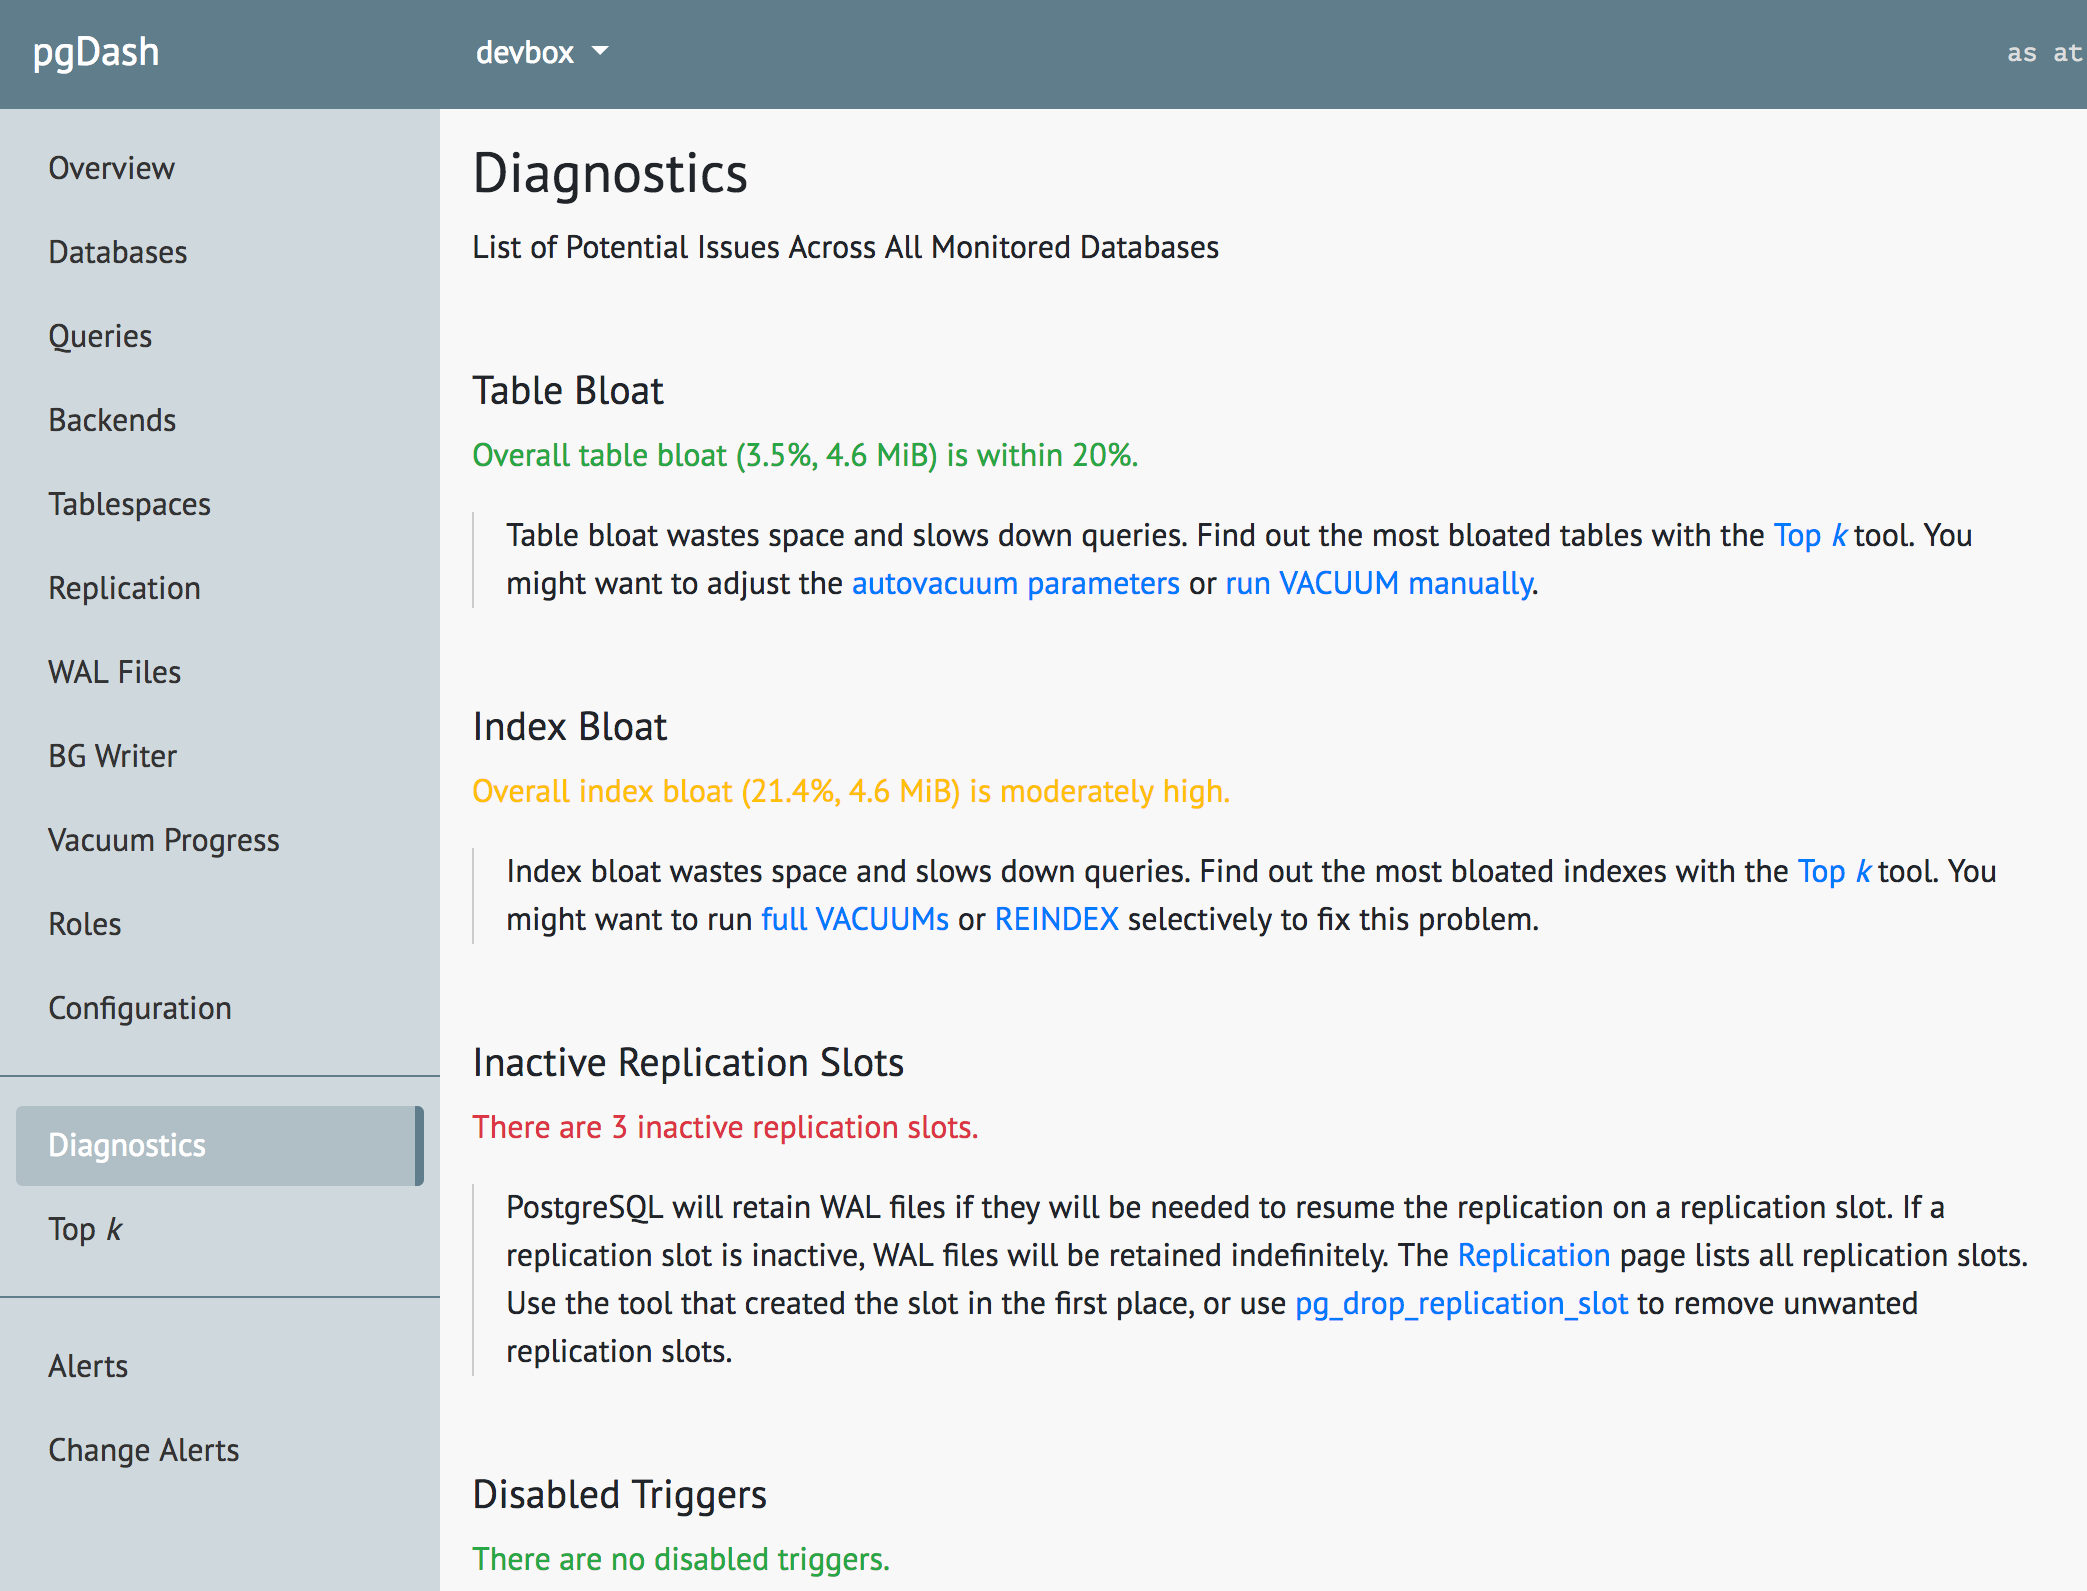
The Diagnostics feature in pgDash examines your PostgreSQL server and databases scanning for potential issues that can impact the health and performance of the deployment. No additional setup is required for Diagnostics - you just need to be actively sending in data to pgDash. Learn more here or signup today for a free trial.