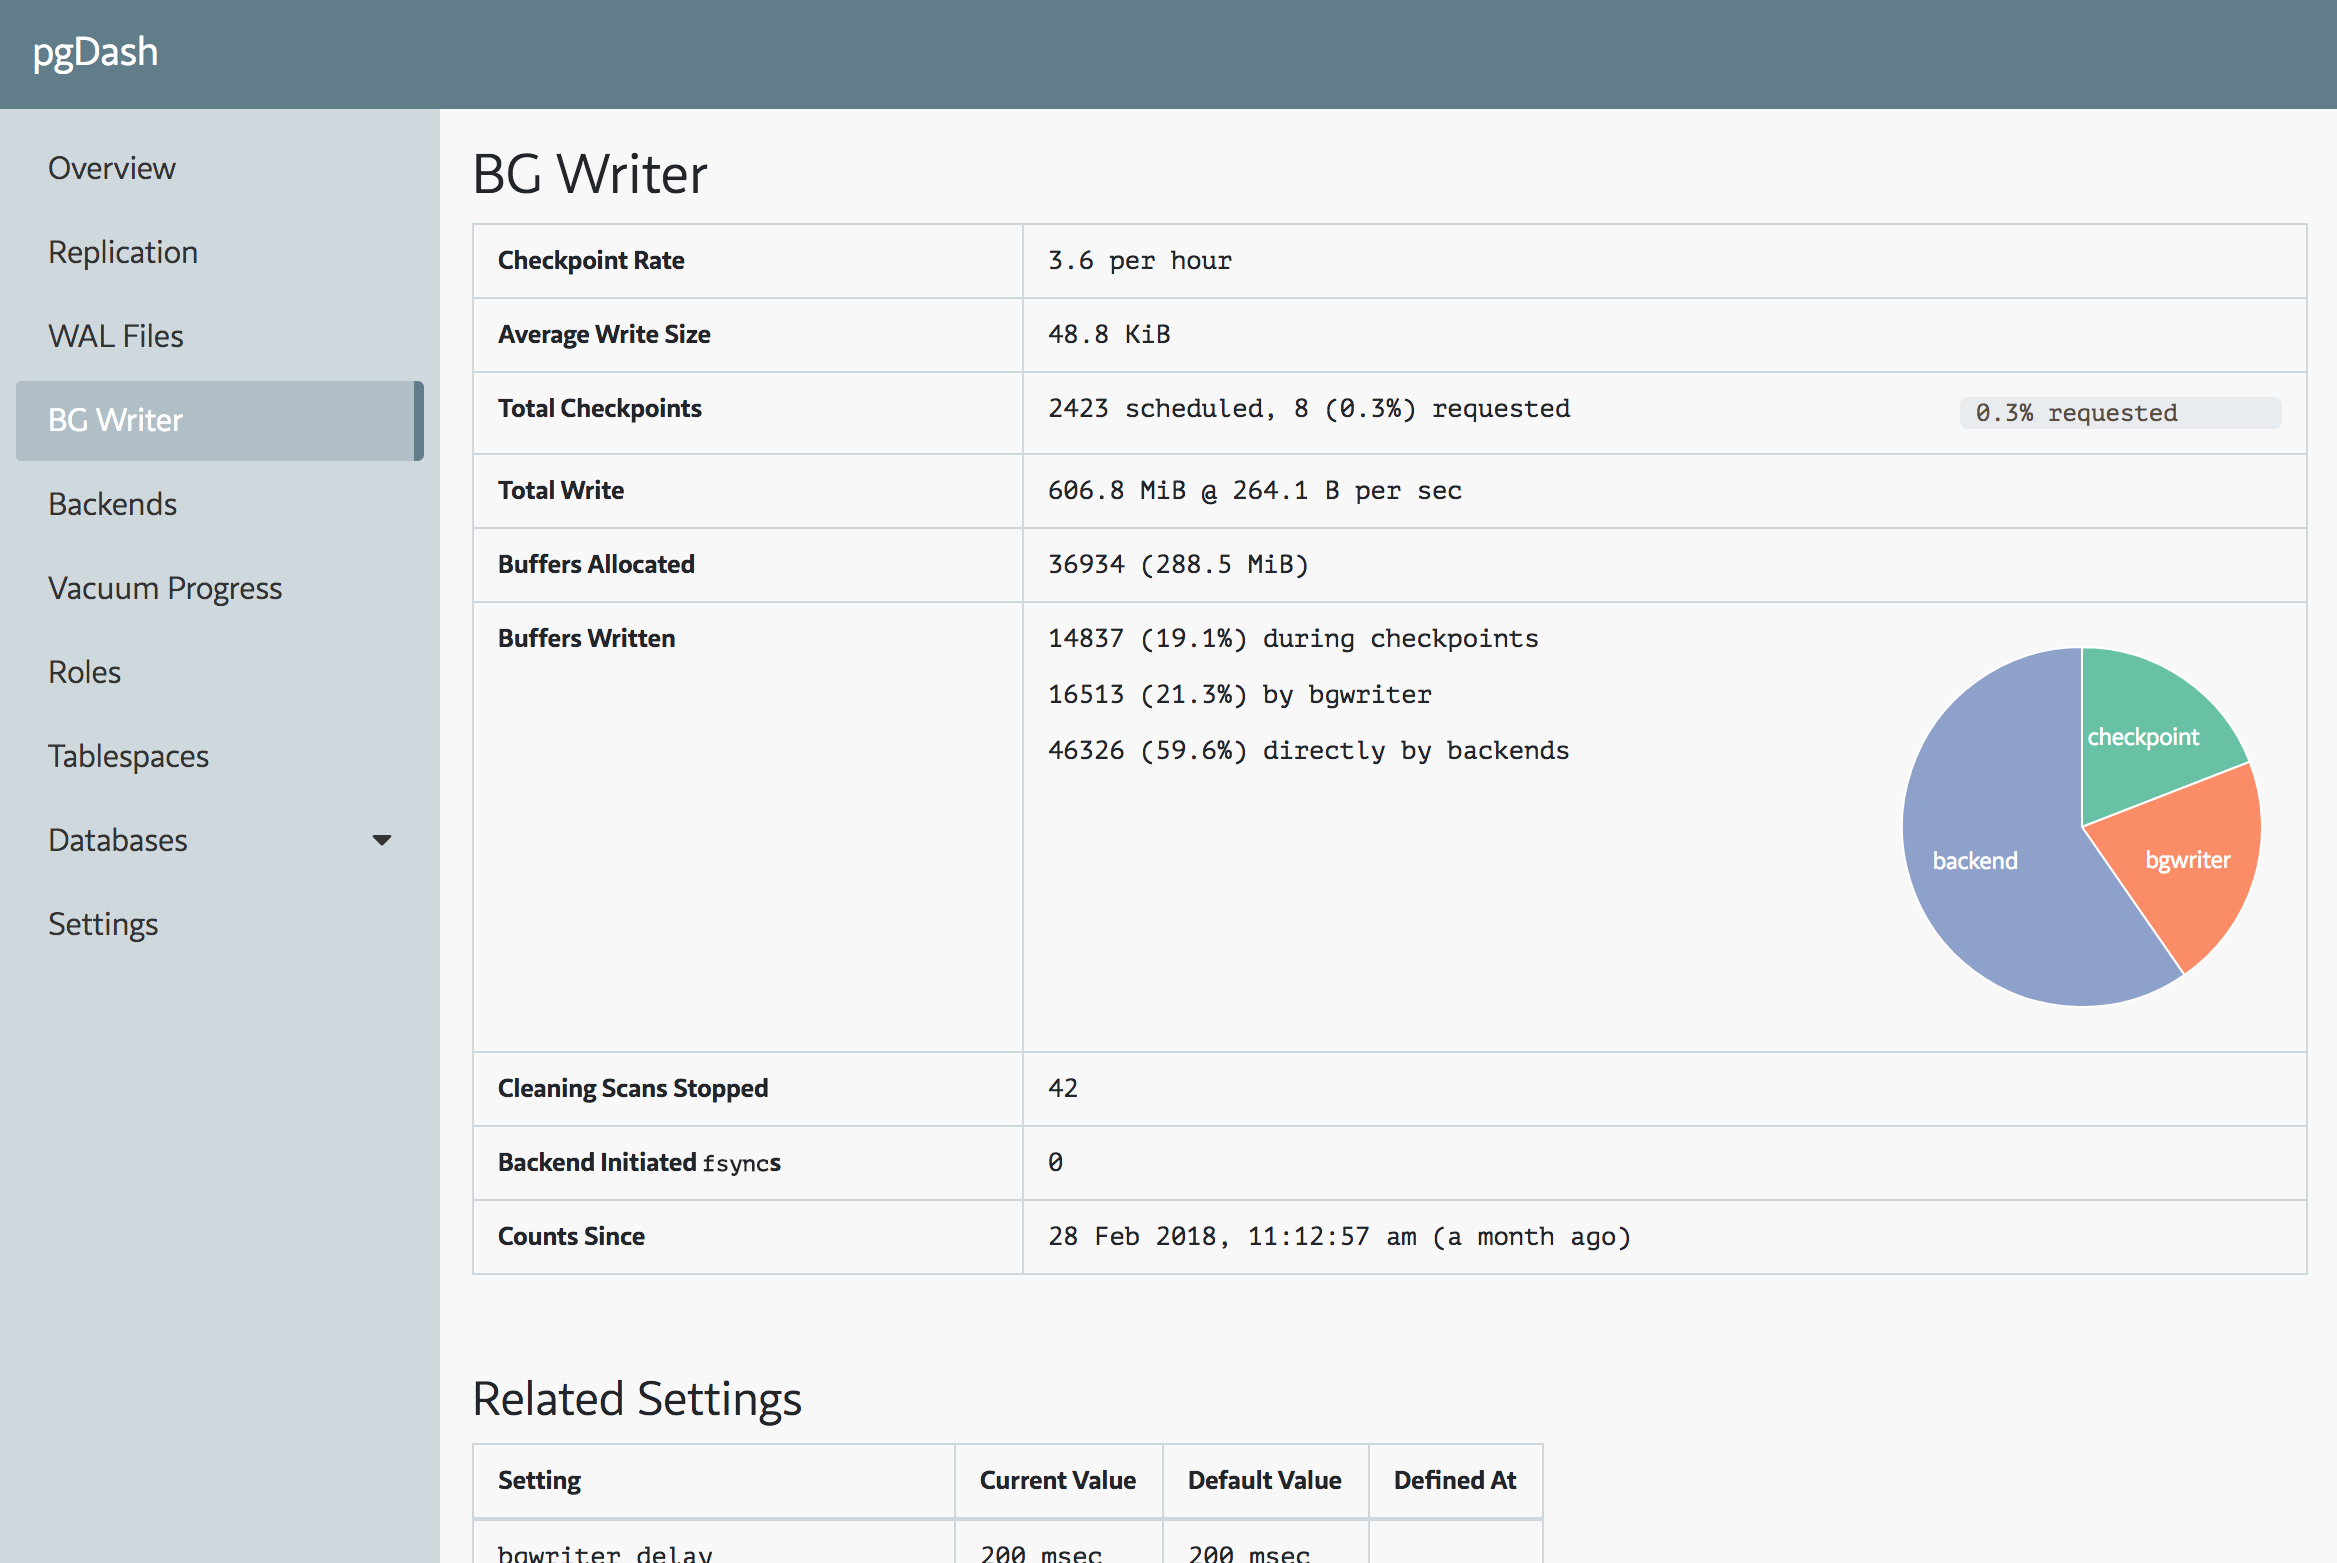
pgDash is an in-depth monitoring solution designed specifically for PostgreSQL deployments. pgDash shows you information and metrics about every aspect of your PostgreSQL database server, collected using the open-source tool pgmetrics.
The pgDash Beta currently provides core reporting and visualization functionality, including collecting and displaying PostgreSQL information and providing time-series graphs and detailed reports. We’re actively working to enhance pgDash based on your feedback and will be working to expand pgDash to include alerting, baselines, teams, and more.
The Beta version of pgDash is now available for you to try. pgDash is free during Beta and no credit card is required to signup. We just ask for your feedback! We’re actively developing out the pgDash feature set, and your feedback is critical to the process.
To Get Started:
- Signup here.
- Follow the instructions in the Getting Started section of the pgDash Docs.
- Try it out and let us know what you think!
If you have any questions at all along the way, feel free to let us know. And, once you’ve had a chance to try out pgDash, please do let us your thoughts. Your feedback is critical to guiding the ongoing development of pgDash and we look forward to hearing from you. You can reach us by email or via the chat app on pgDash.
If you are interested in trying out the self-hosted / on-premise version of pgDash instead, please let us know and we’ll follow up with the details soon.
