PostgreSQL comes with various ways of replicating data between servers, along with configuration options to tweak and tune the replication process to fit your needs. Regardless of what type of replication you set up, it is important to monitor all endpoints of replication to ensure that your data is safe and sound.
Read on to learn more about monitoring replication in Postgres.
Types of Replication
Broadly, there are 2 types of replication in PostgreSQL – physical and logical. Here is a quick overview picture:
                    +---------------------------------------------------+
                    |                                                   |
                    |             Replication in PostgreSQL             |
                    |                                                   |
                    +-+-----------------------------------------------+-+
                      |                                               |
                      |                                               |
              +-------v----+                                      +---v-------+
              |  Physical  |                                      |  Logical  |
              +-+---------++                                      +-----+-----+
                |         |                                             |
                |         |                                             |
+---------------v+       +v------------+                       +--------v--------+
|  Log Shipping  |       |  Streaming  |                       |     Logical     |
+----------------+       ++----------+-+                       |   Replication   |
                          |          |                         |      Slots      |
                          |          |                         +--------+--------+
                          |          |                                  |
                          |          |                                  |
              +-----------v---+   +--v--------------+          +--------v--------+
              |    Without    |   |  With Physical  |          |  Subscriptions  |
              |  Replication  |   |   Replication   |          +-----------------+
              |     Slots     |   |      Slots      |
              +---------------+   +-----------------+
Let’s have a quick look at each before we see how to monitor them. In the text below, per convention, the term primary refers to the master or originating server, and standby refers to the slave or receiving server.
Physical Replication
Physical replication has been available in core Postgres for more than a decade. It allows you to replicate the data in a primary server byte for byte into a standby server.
Essentially, physical replication relies on sending WAL (write ahead log) files generated by the primary over to the secondary. When changes happen on the primary server, these are serialized and flushed to disk as a series of WAL files. These files can be “replayed” to get the familiar SQL-structured representation of data. Even the primary server itself writes the record first, then a bit later, replays the record and updates the SQL-structured representation.
Therefore, it stands to reason that you can send over these WAL files to another server and have it replay them instead. And that’s exactly how physical replication works.
The standby server is setup not to accept changes via the normal DDL/DML statements but only via accepting and replaying WAL files. A server configured this way is said to be in recovery mode.
A standby in recovery mode will not (cannot) perform changes to its data using normal SQL transactions. You can however allow read-only SQL transactions on it by making it a hot standby. Because the original changes at the primary have to be brought to the standby and replayed, the queries at the hot standby will potentially see an earlier version of the data. This is the replication lag. The replication lag at each standby is one of the things you should be monitoring.
Log Shipping
Since WAL files are actual, simple physical files typically 16MB in size and
living in the pg_wal (or pg_xlog prior to v10) subdirectory of $PGDATA, you
can simply copy them over to another server with scp or via NFS or the like.
The standby server is setup to accept these WAL files using the restore_command or dropping them in the pg_wal directory.
Streaming Replication
Rather than copying WAL files through scripts, streaming replication allows the standby to establish a connection the primary and “stream” the contents of the WAL file over this connection.
Streaming replication is not only much cleaner, but also has the advantage of smaller replication lags for low-TPS servers. This is because the WAL files in turn contain smaller records arranged sequentially – in streaming replication each record can be streamed when created, whereas in log shipping you’ll have to wait for the whole WAL file to be assembled, which may take a while.
Streaming replication was introduced in Postgres 9.0.
Physical Replication Slots
In Postgres 9.4, replication slots were introduced. A process receiving changes via streaming replication can create a replication slot on the primary server. The primary will then use this slot to store the location up to where the changes have been sent to the receiver.
If the receiver were to disconnect for a long while and then reconnect, the primary would now retain those WAL files that are required for the receiver to catch up.
Streaming replication is possible with and without the use of replication slots. Using replication slots of course, makes it more reliable.
Logical Replication
Logical replication was introduced in core PostgreSQL in version 10. Unlike physical replication, logical replication brings over only the logical, or SQL-like changes. It aims to be the foundation for currently unavailable features like multi-master replication and zero-downtime major-version upgrades.
Logical replication works only via replication slots. A replication slot can be created for either physical replication or logical replication.
The logical replication data received by a process has to be “decoded” using a “plugin”. For more information see the docs and the wiki.
Subscriptions
The publication / subscription feature built into Postgres 10 is a means of using logical replication. In a way, this feature is a “UI” for logical replication.
Replication Topology
PostgreSQL allows sending one primary’s changes to multiple standbys and even cascading them further. This allows for complex replication topologies (check out the article Replication Topologies in PostgreSQL to learn more).
There are however, a couple of simple rules to keep the story straight:
- a server is either in recovery mode (that is, it is a standby) or not
- a standby will receive incoming WALs and replay them
- a server can send it’s own WALs to 0 or more other servers
These rules are primarily for physical replication. For logical replication, changes can be sent from anywhere to anywhere and they are monitored only via their replication slots.
Monitoring Standby Servers
A standby server has incoming replication, and remains in recovery mode so that it can replay the WALs/records as they come in.
Monitoring Incoming Replication
The stats related to the incoming replication can be monitored using pg_stat_wal_receiver view (available in v9.6 and above). On a standby, it contains values similar to:
bench=# select * from pg_stat_wal_receiver;
-[ RECORD 1 ]---------+------------------------------
pid                   | 2084
status                | streaming
receive_start_lsn     | 0/3000000
receive_start_tli     | 1
received_lsn          | 0/11233E20
received_tli          | 1
last_msg_send_time    | 2018-05-02 04:47:53.334477-04
last_msg_receipt_time | 2018-05-02 04:47:53.334519-04
latest_end_lsn        | 0/11233E20
latest_end_time       | 2018-05-02 04:46:53.261754-04
slot_name             |
conninfo              | [removed for brevity]
This shows that there is a single “WAL receiver” process with PID 2084, which
is currently active, and has received data from 0/3000000 up to 0/11233E20.
The timeline ID
was 1 when it started, and is 1 even now. The difference between the send and
receipt times of the last message indicates the latency of the connection,
which in this case is less than 1 millisecond. The difference between the two
LSNs (start and end) shows the amount of data received over the connection
(0x11233E20 - 0x03000000 = about 226 MiB). It also says that this connection
does not use a replication slot – if it did, the “slot_name” column would not
be null.
Here is another standby which does use a replication slot:
bench=# select * from pg_stat_wal_receiver;
-[ RECORD 1 ]---------+------------------------------
pid                   | 2326
status                | streaming
receive_start_lsn     | 0/15000000
receive_start_tli     | 1
received_lsn          | 0/15000060
received_tli          | 1
last_msg_send_time    | 2018-05-02 05:04:48.537842-04
last_msg_receipt_time | 2018-05-02 05:04:48.537887-04
latest_end_lsn        | 0/15000060
latest_end_time       | 2018-05-02 05:04:48.537842-04
slot_name             | myreplslot1
conninfo              | [removed for brevity]
Monitoring Recovery Status
The pg_stat_wal_receiver only gives stats about the receiving of WAL records, not of it’s replay. For that, we need to use:
bench=# select pg_last_wal_receive_lsn(), pg_last_wal_replay_lsn(), pg_last_xact_replay_timestamp();
-[ RECORD 1 ]-----------------+------------------------------
pg_last_wal_receive_lsn       | 0/1A000000
pg_last_wal_replay_lsn        | 0/19FFE928
pg_last_xact_replay_timestamp | 2018-05-02 05:13:42.141768-04
This shows that the last received WAL position is ahead of the last replayed WAL position, and there is a replay lag of 0/1A000000 - 0/19FFE928 = 5848 bytes. If there is a replay lag, the difference between the time the query was run and the last transaction replay timestamp is a measure of the replay lag in units of time.
Monitoring Primary Servers
There are two type of things to monitor on primary servers – outgoing replication connections and replication slots.
Monitoring Outgoing Replication
The system view pg_stat_replication returns one row for each open outgoing replication connection.
bench=# select * from pg_stat_replication;
-[ RECORD 1 ]----+------------------------------
pid              | 2327
usesysid         | 10
usename          | mdevan
application_name | walreceiver
client_addr      |
client_hostname  |
client_port      | -1
backend_start    | 2018-05-02 05:04:48.536888-04
backend_xmin     |
state            | streaming
sent_lsn         | 0/277628F8
write_lsn        | 0/277628F8
flush_lsn        | 0/277628F8
replay_lsn       | 0/277628F8
write_lag        | 00:00:00.000049
flush_lag        | 00:00:00.00053
replay_lag       | 00:00:00.000562
sync_priority    | 0
sync_state       | async
-[ RECORD 2 ]----+------------------------------
pid              | 2085
usesysid         | 10
usename          | mdevan
application_name | walreceiver
client_addr      |
client_hostname  |
client_port      | -1
backend_start    | 2018-05-02 04:35:36.559838-04
backend_xmin     |
state            | streaming
sent_lsn         | 0/277628F8
write_lsn        | 0/277628F8
flush_lsn        | 0/277628F8
replay_lsn       | 0/277628F8
write_lag        |
flush_lag        |
replay_lag       |
sync_priority    | 0
sync_state       | async
We can see the WAL locations corresponding to send, write, flush
and replay. In Postgres 10, the write, flush and replay lags are also
available. The value of async for sync_state shows that the clients are
not synchronous standbys.
Monitoring Physical Replication Slots
The view pg_replication_slots gives one row for each replication slot in the primary. Unlike streaming replication connections, replication slots have to be created and deleted explicitly. When there is an associated client connection, slots are considered active. Inactive slots are dangerous, because the server will retain the WAL files required for that slot forever, at the risk of filling up the disk.
Replicaton slots can also be temporary, which will go away when the replication client connection goes away. Newer versions of pg_basebackup use temporary replication slots.
bench=# select * from pg_replication_slots;
-[ RECORD 1 ]-------+--------------
slot_name           | mylogslot
plugin              | test_decoding
slot_type           | logical
datoid              | 16384
database            | bench
temporary           | f
active              | t
active_pid          | 2607
xmin                |
catalog_xmin        | 356948
restart_lsn         | 0/3B44A5A0
confirmed_flush_lsn | 0/3B44A5A0
-[ RECORD 2 ]-------+--------------
slot_name           | myreplslot1
plugin              |
slot_type           | physical
datoid              |
database            |
temporary           | f
active              | t
active_pid          | 2598
xmin                |
catalog_xmin        |
restart_lsn         | 0/3B44A5D8
confirmed_flush_lsn |
The physical replication slot “myreplslot1” (value of slot_type is physical) is active,
not temporary and it’s client has received up to 0/3B44A5D8.
Monitoring Logical Replication Slots
The logical replication slot “mylogslot” (value of slot_type is logical)
is also active and permanent. It’s client has received up to 0/3B44A5A0 and has
confirmed that there is no flush lag. The plugin used is “test_decoding” (
because the client for this setup was pg_recvlogical).
Monitoring Using pgmetrics
The open-source tool pgmetrics can query Postgres
servers and produce detailed reports, including for replication. You can
invoke pgmetrics pretty much like psql, with the same command-line options
and environment variables.
Here is the pgmetrics output for a primary replicating to two physical standbys and one logical receiver. It also shows the physical and logical replication slots:
Outgoing Replication Stats:
    Destination #1:
      User:              mdevan
      Application:       walreceiver
      Client Address:
      State:             streaming
      Started At:        2 May 2018 5:34:35 AM (14 minutes ago)
      Sent LSN:          0/4523E000
      Written Until:     0/4523E000 (no write lag)
      Flushed Until:     0/4523E000 (no flush lag)
      Replayed Until:    0/4523DFC0 (replay lag = 64 B)
      Sync Priority:     0
      Sync State:        async
    Destination #2:
      User:              mdevan
      Application:       walreceiver
      Client Address:
      State:             streaming
      Started At:        2 May 2018 5:34:35 AM (14 minutes ago)
      Sent LSN:          0/4523E000
      Written Until:     0/4523E000 (no write lag)
      Flushed Until:     0/4523E000 (no flush lag)
      Replayed Until:    0/4523DFC0 (replay lag = 64 B)
      Sync Priority:     0
      Sync State:        async
    Destination #3:
      User:              mdevan
      Application:       pg_recvlogical
      Client Address:
      State:             catchup
      Started At:        2 May 2018 5:48:40 AM (1 second ago)
      Sent LSN:          0/451E9D68
      Written Until:
      Flushed Until:
      Replayed Until:
      Sync Priority:     0
      Sync State:        async

Physical Replication Slots:
    +-------------+--------+---------------+-------------+-----------+
    |        Name | Active | Oldest Txn ID | Restart LSN | Temporary |
    +-------------+--------+---------------+-------------+-----------+
    | myreplslot1 |    yes |               |  0/4523E000 |        no |
    +-------------+--------+---------------+-------------+-----------+

Logical Replication Slots:
    +-----------+---------------+----------+--------+---------------+-------------+---------------+-----------+
    |      Name |        Plugin | Database | Active | Oldest Txn ID | Restart LSN | Flushed Until | Temporary |
    +-----------+---------------+----------+--------+---------------+-------------+---------------+-----------+
    | mylogslot | test_decoding |    bench |    yes |               |  0/449350A8 |    0/44F01F30 |        no |
    +-----------+---------------+----------+--------+---------------+-------------+---------------+-----------+
On the receiving end, it shows the recovery and the incoming replication status, including the lags in both bytes and time where relevant:
Recovery Status:
    Replay paused:       no
    Received LSN:        0/514A2000
    Replayed LSN:        0/5149AAB0 (lag = 29 KiB)
    Last Replayed Txn:   2 May 2018 5:50:15 AM (now)

Incoming Replication Stats:
    Status:              streaming
    Received LSN:        0/514A2000 (started at 0/3B000000, 357 MiB)
    Timeline:            1 (was 1 at start)
    Latency:             183µs
    Replication Slot:
pgmetrics can also generate the results in JSON format, which can be used in scripts for monitoring or alerting.
Monitoring Using pgDash
pgDash is an in-depth monitoring solution designed specifically for PostgreSQL deployments. pgDash shows you information and metrics about every aspect of your PostgreSQL database server, collected using the open-source tool pgmetrics.
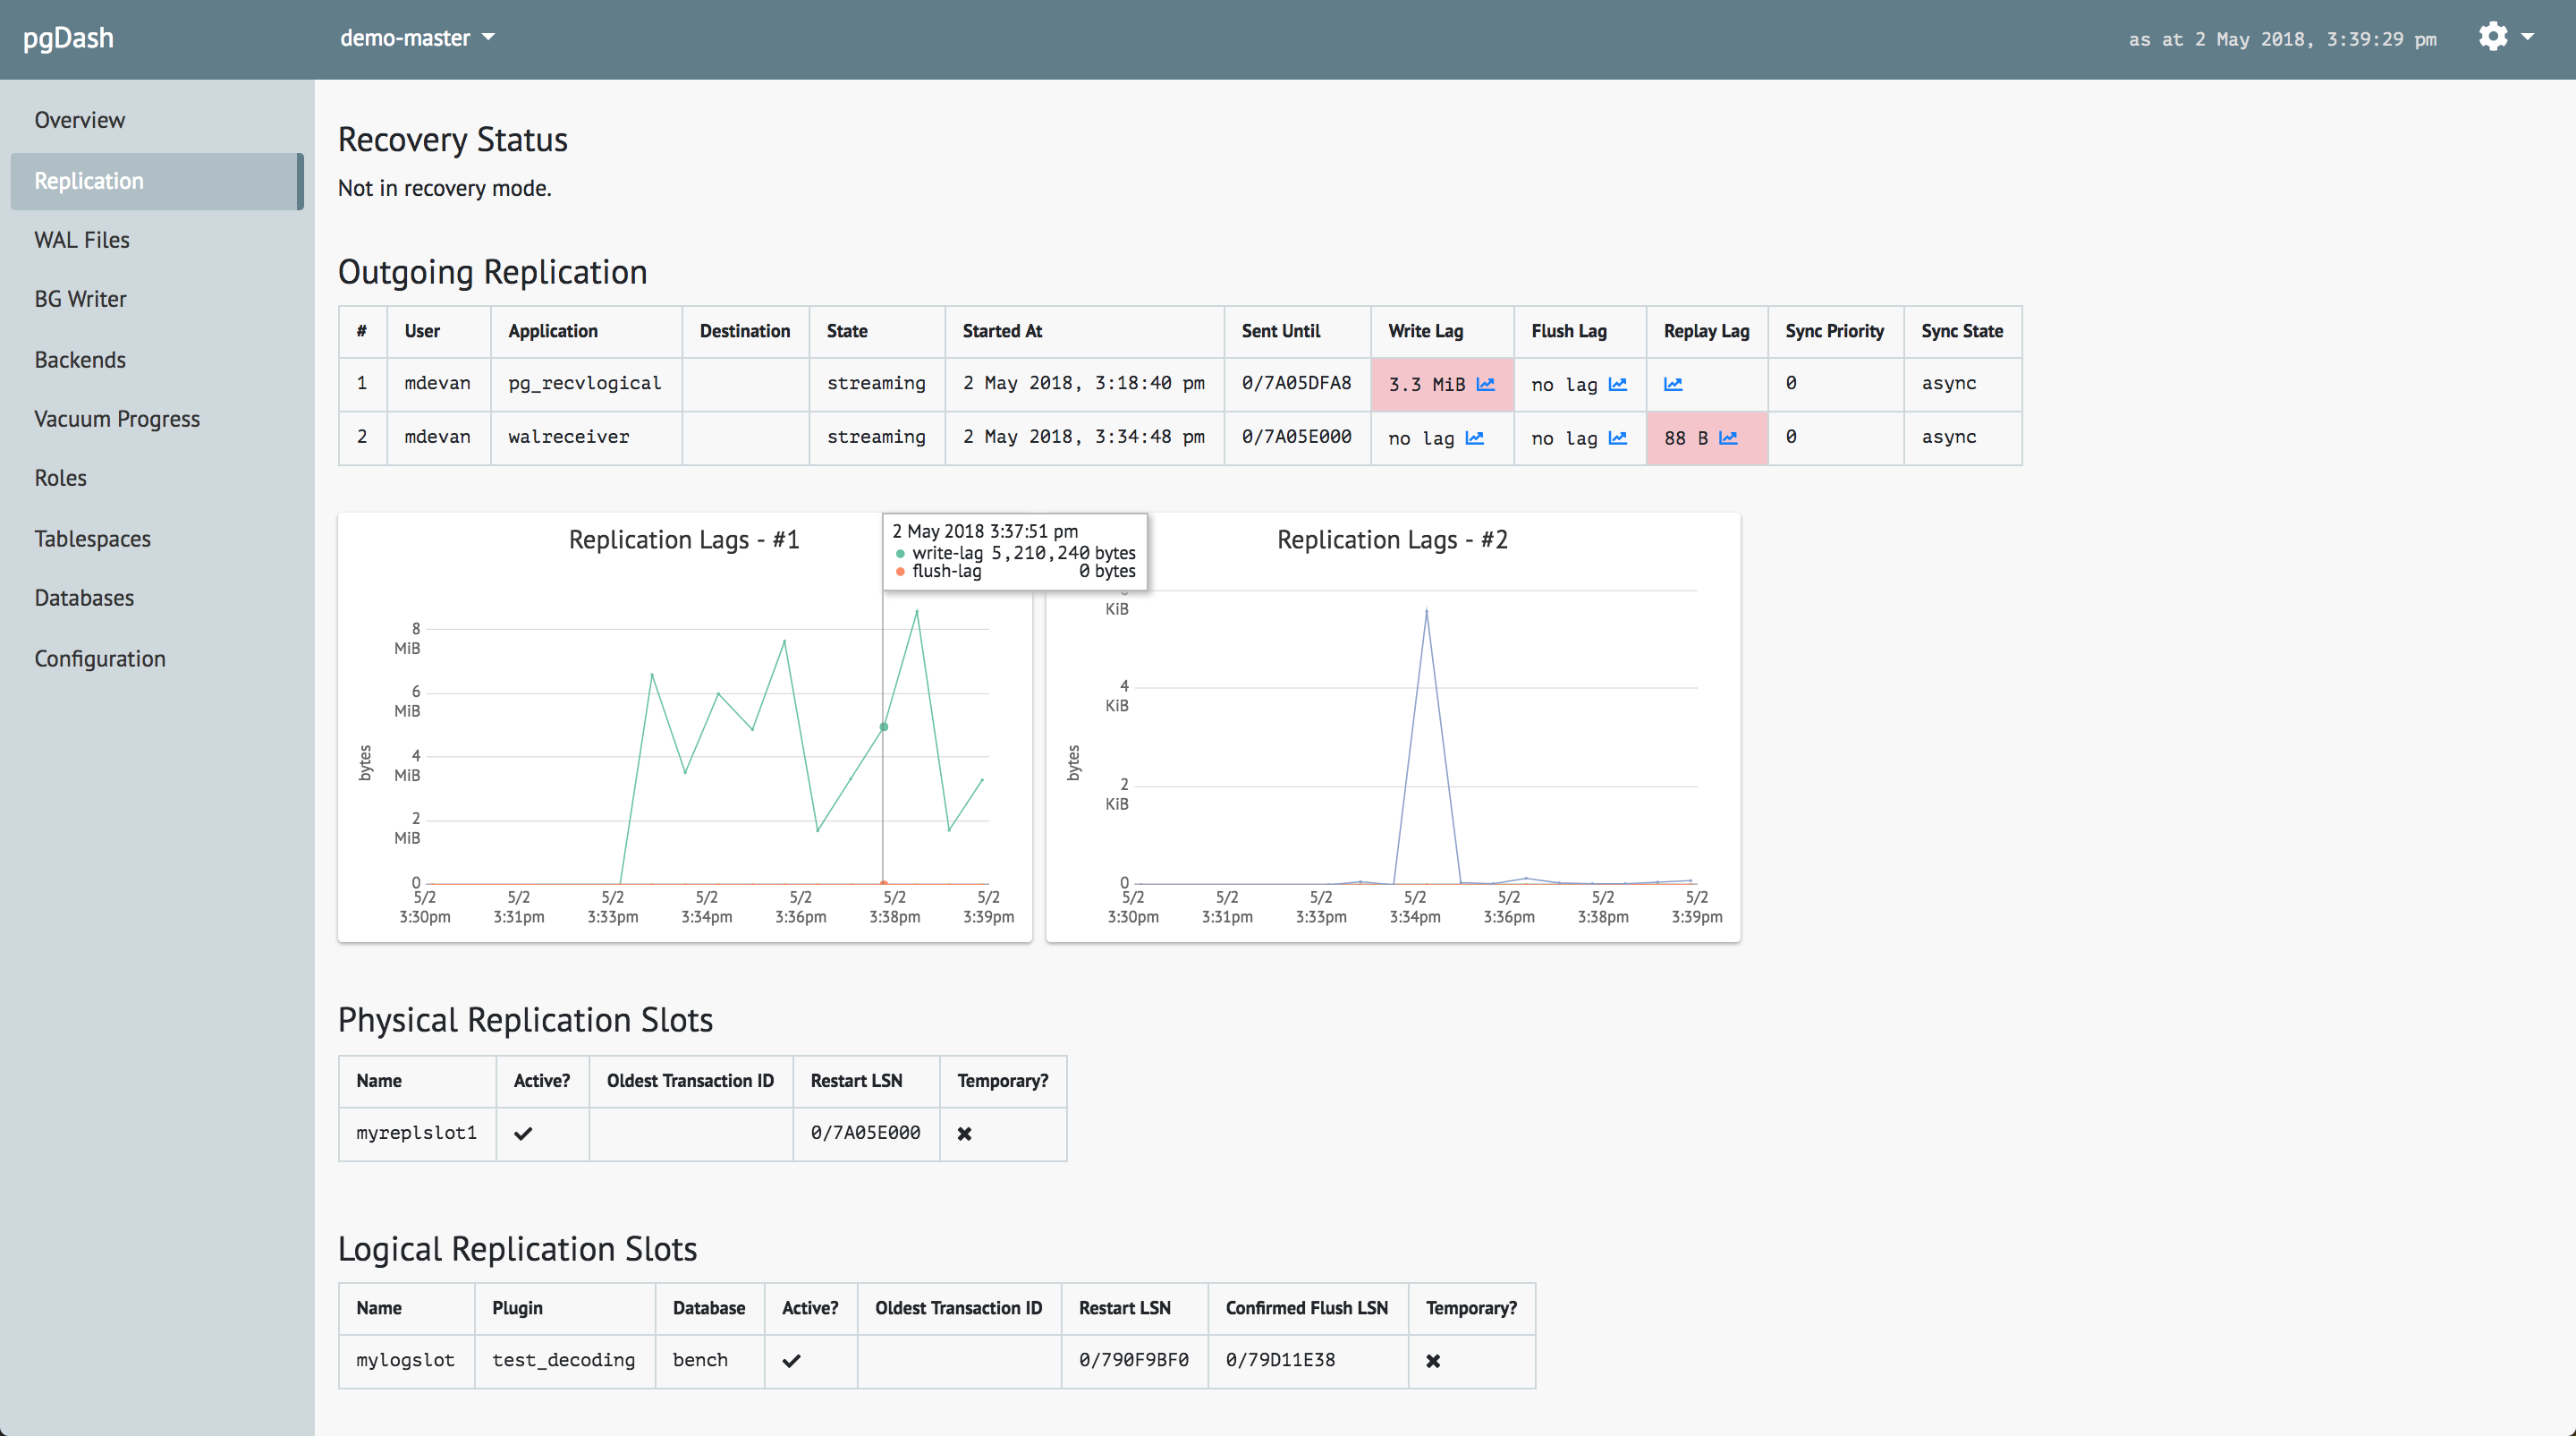
In addition displaying the data interactively, it also stores metrics extracted from the pgmetrics report as timeseries data and displays them graphically. Here is how it displays the replication information on the primary side:
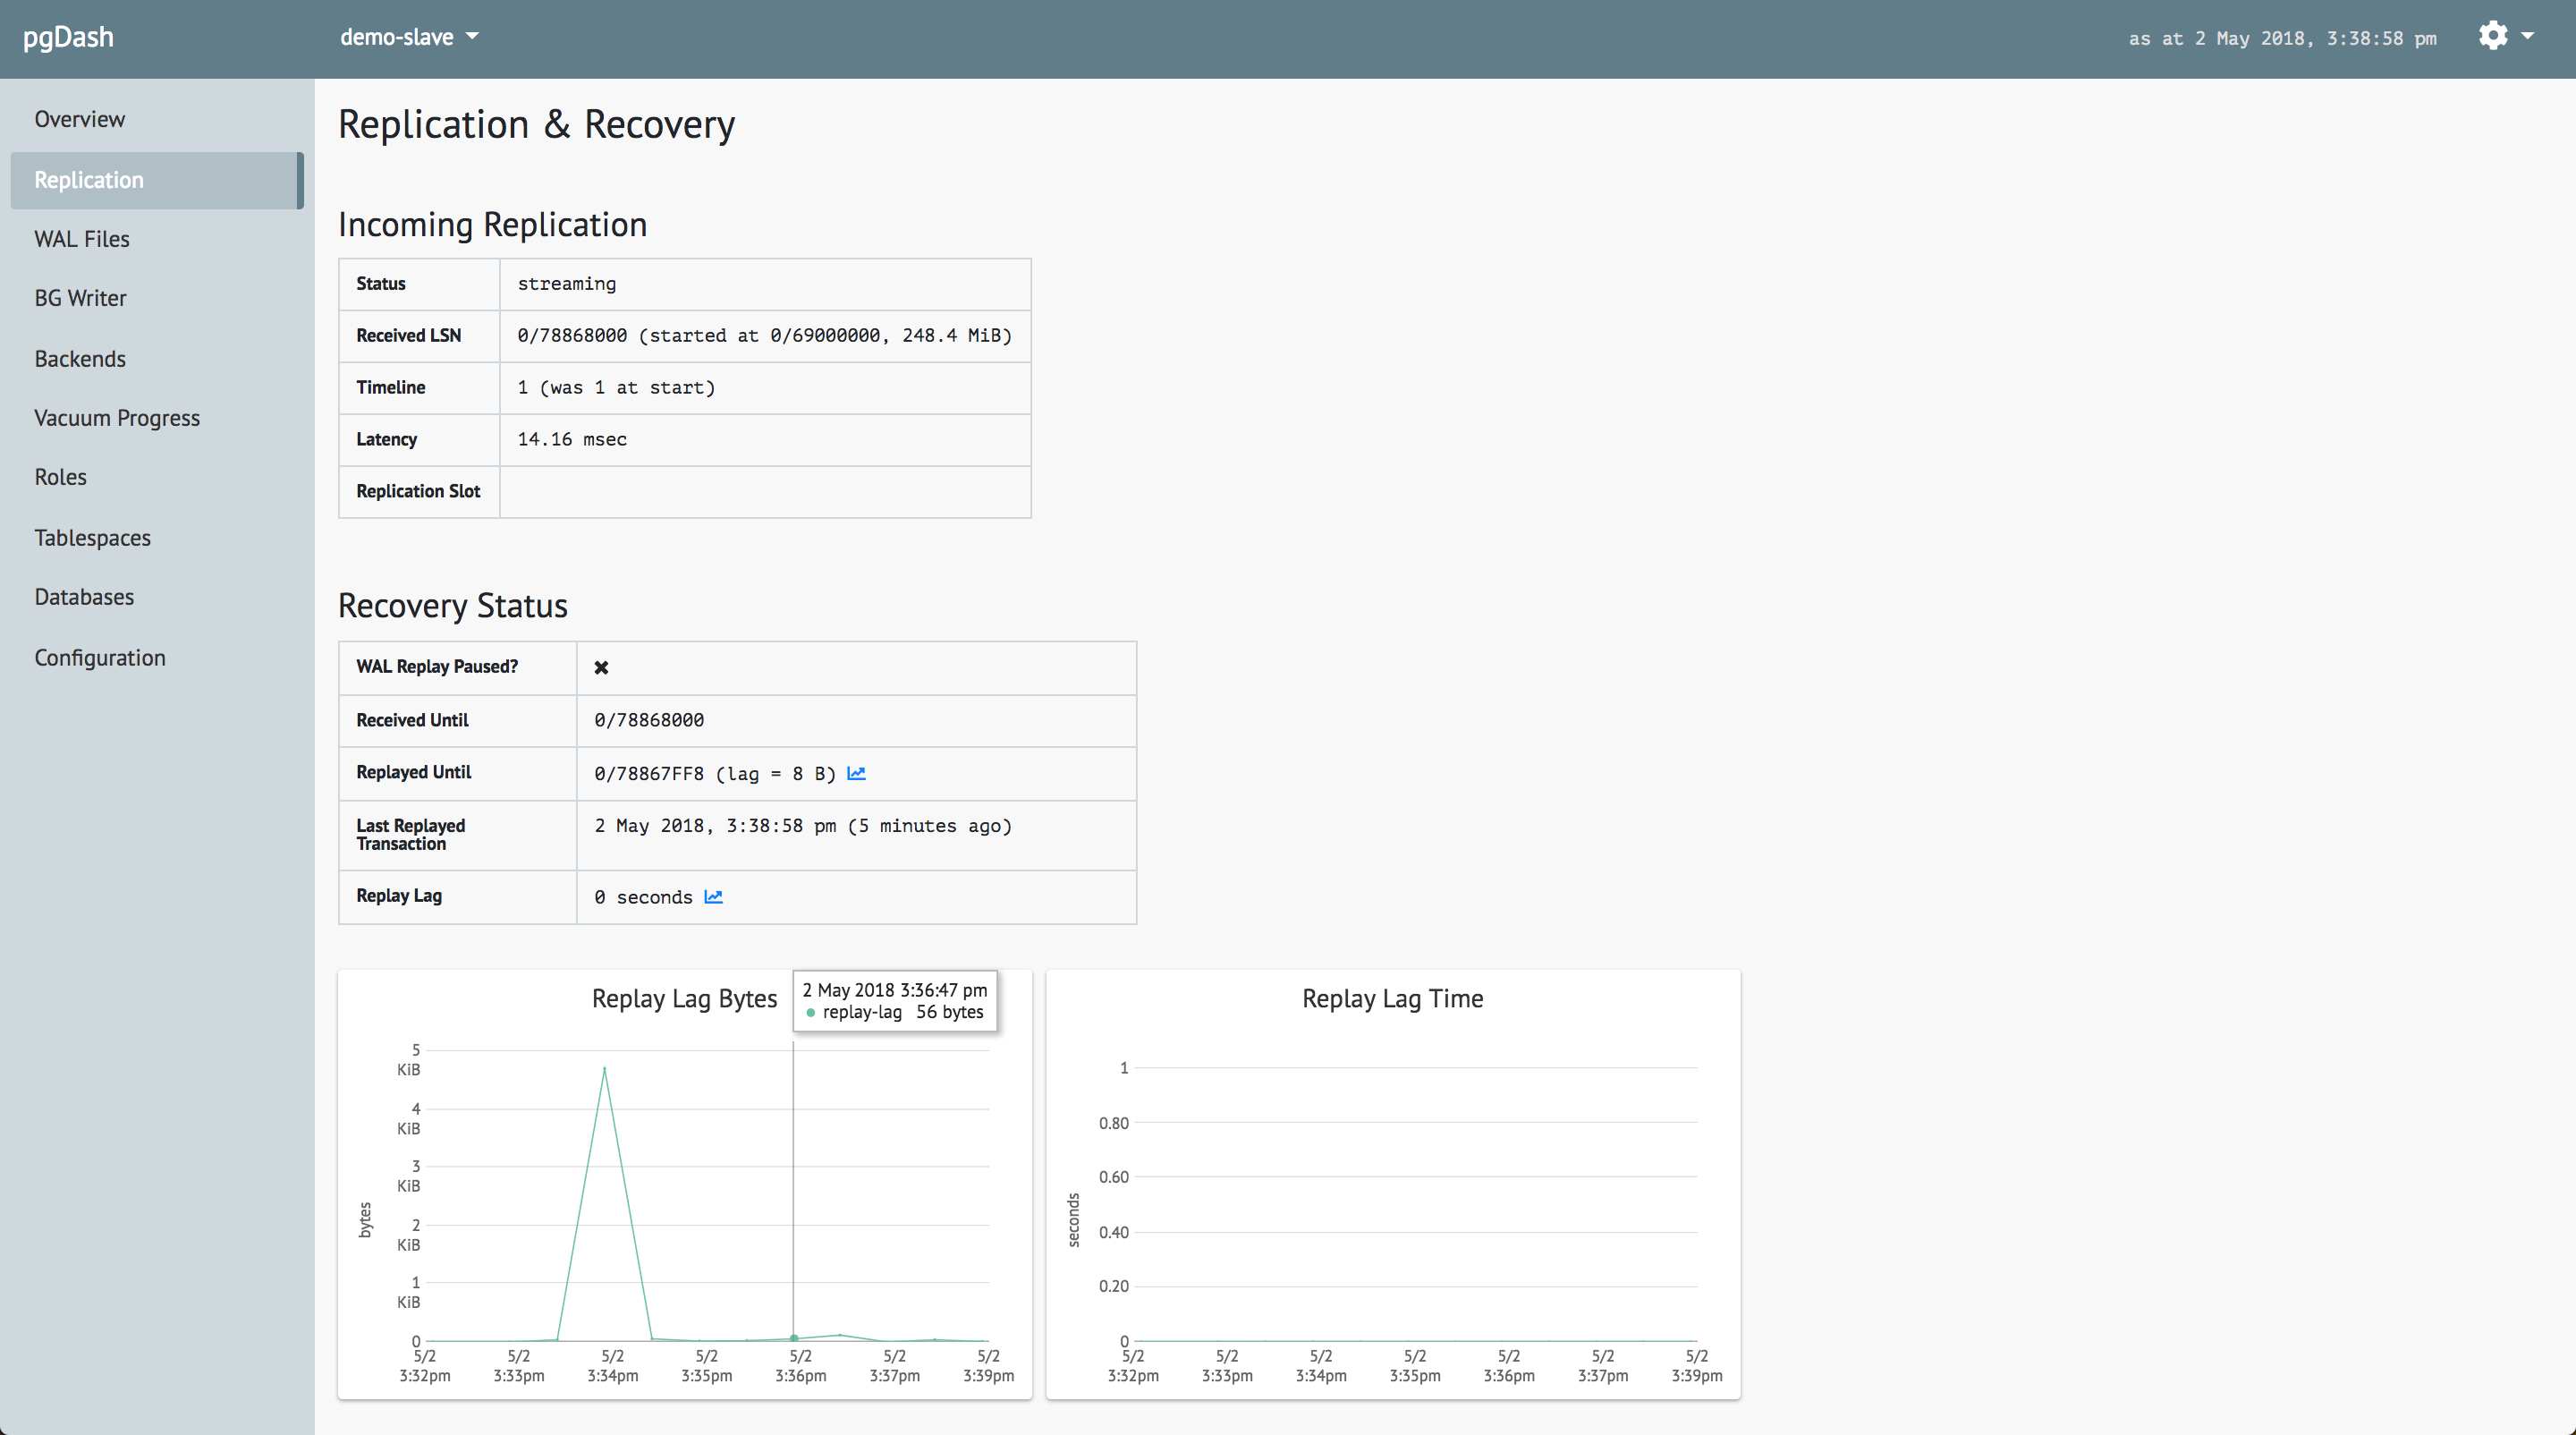
And for the standby server:
pgDash provides core reporting and visualization functionality, including collecting and displaying PostgreSQL information and providing time-series graphs and detailed reports. We’re actively working to enhance and expand pgDash to include alerting, baselines, teams, and more.