What metrics of your PostgreSQL deployment should you be monitoring? This series of blog posts aims to provide a minimal, starting set of essential monitoring actions that you should implement to ensure the health and stability of your Postgres servers.
The first part covers cluster-level parameters.
Part 1: Cluster Level
In Postgres jargon, a cluster is a set of databases managed by a single Postgres server instance. Features like replication and WAL archival work at cluster level.
1. Transaction ID Range
From a normal client’s perspective, the data files of a PostgreSQL cluster will appear to contain the snapshot of data as modified by the last committed transaction. However, because of Postgres’ MVCC architecture, the physical files contain not just the data for the most recent transaction, but for a range of transactions ending with the latest one. (Regular vacuuming gets rid of the data for the older transactions.)
Each transaction has a unique 32-bit integer identifier, called the transaction ID. For various reasons, the difference of the first and last transaction IDs should be less than 231, which is around 2 billion. Keeping the range well below this limit is a must – read this real-life story of what happens otherwise.
Action: Continuously monitor the transaction ID range, alert if value exceeds a set threshold.
How To:
-- returns the first and last transactions IDs for the cluster
SELECT oldest_xid::text::int as first,
       regexp_replace(next_xid, '^[0-9]+:', '')::int-1 as last
  FROM pg_control_checkpoint();

-- returns the transaction ID range for each database
SELECT datname, age(datfrozenxid)
  FROM pg_database;
2. Number of Backends
Each backend represents either a client connected to the server, or a system backend process (like auto vacuum worker, background writer etc). Each backend is also an OS process that consumes OS resources like memory, open file descriptors etc. Too many backends, typically because of too many clients or too many long-running queries can put pressure on OS resources and slow down query response times for every client.
Action: Monitor the maximum backend count over each day/week, investigate increasing trends.
How To:
-- returns the count of currently running backends
SELECT count(*)
  FROM pg_stat_activity;
3. Inactive Replication Slots
Replication slots are marked as ‘inactive’ when the replication client connected to the slot disconnects. Inactive replication slots cause WAL files to be retained, since they’ll have to be sent to the client when it reconnects and the slots become active. Indeed, the first thing to check if your WAL file counts don’t go down is to see if you have inactive replication slots.
Often inactive replication slots are the result of a backup client that was removed, a slave that was taken down, promotions, failovers and the like.
Action: Continuously check for inactive replication slots, alert if any.
How To:
-- returns the count of inactive replication slots
SELECT count(*)
  FROM pg_replication_slots
 WHERE NOT active;
4. Backends Waiting on Locks
SQL statements can explicitly or implicitly cause other SQL statements to wait. For example, running a “SELECT .. FOR UPDATE” explicitly declares a lock for the selected rows, and running an “UPDATE” places implcit row-exclusive locks. Other SQL statements when encountering the lock will have to wait until the first statement relinquishes the lock, before continuing it’s execution.
This can manifest as slow application performance during weekly report runs, timed out transactions/web pages and the like.
While some amount of locking cannot be avoided, an increasing trend of backends waiting for locks typically calls for queries or application logic to be restructured.
Action: Monitor the maximum number of backends waiting on locks over each day/week, investigate increasing trends.
How To:
-- returns the count of backends waiting on locks
SELECT count(*)
  FROM pg_stat_activity
 WHERE wait_event = 'Lock';
5. Backends Idling in Transaction
Long-running transactions are not very nice to have in the PostgreSQL world. They can cause WAL files to build up, prevent autovacuum and manual vacuum, and use up resources. Nothing much can be done about genuine transactions that take a long time to complete, but there are cases like misbehaving apps/scripts and the occasional psql client that start transactions but do not close them. Backends that serve such clients appear as “idling in transaction”.
Backends that are idling in transaction should be detected and shut down before they start affecting system stability.
Action: Continuously monitor the number of backends idling in transaction, review if any are found.
How To:
-- returns the count of backends waiting on locks
SELECT count(*)
  FROM pg_stat_activity
 WHERE state = 'idle in transaction';
6. Replication Lag for Active Connections
When there are active streaming replication clients (like hot standbys) or active logical replication clients, Postgres runs a system backend called a WAL sender for each active (connected) client. The WAL sender is responsible for sending the WAL record data that the client needs.
Replication clients typically try to keep up as much as they can with the primary. At times, however, the WAL generation rate at the primary side can become higher than the rate at which the client is able to consume them. This results in a replication lag for each replication connection.
PostgreSQL provides a mechanism to query to write lag (no. of bytes sent but not written to client’s disk), flush lag (no. of bytes written but not flushed to client’s disk) and replay lag (no. of bytes flushed but not replayed into the client’s database files) for each active WAL sender.
Action: Continuously monitor replication lags for active connections, alert if values exceed set thresholds.
How To:
-- returns the write, flush and replay lags per WAL sender, as described above
SELECT write_lsn - sent_lsn AS write_lag,
       flush_lsn - write_lsn AS flush_lag,
       replay_lsn - flush_lsn AS replay_lag
  FROM pg_stat_replication;
7. Replication Lag for Replication Slots
Not only can repication clients lag, they can also disappear altogether because of crashes, topology changes or human error. It may also be by design, where clients are not always online.
If the client is backed by a replication slot, then all WAL files necessary for the client to resume from the point it left off are retained by PostgreSQL. The WAL files will be retained indefintely – there is no way to set a limit. When the client does reconnect, all retained data must be streamed to the client first, which can involve a lot of disk and network traffic on the primary. For these reasons, you should be monitoring the lag at slot-level also.
(Note: The WAL sender process runs only when a client is connected, and it exits when the client disconnects. The WAL sender method of measuring how far behind a client is does not work when a client is disconnected.)
Action: Continuously monitor replication lags for logical replication slots, alert if values exceed a set threshold.
How To:
-- returns the replication slot lag in bytes
-- (works only for logical replication slots)
SELECT pg_current_wal_lsn() - confirmed_flush_lsn
  FROM pg_replication_slots;
8. WAL File Count
Managing WAL files can be an exasperating task, especially if you have WAL archiving or streaming replication clients. WAL file counts can start increasing without any apparent reason, the WAL archiving process can fail to keep up with the WAL generation rate, and total WAL file size can get into terabytes.
At the minimum, you need to monitor the count of WAL files present in your database directory and ensure the number looks reasonable for your deployment.
Action: Continuously monitor WAL file count, alert if value exceeds a set threshold.
How To:
-- returns the number of WAL files present in the pg_wal directory (v10+)
SELECT count(*)
  FROM pg_ls_waldir();

-- same, for v9.x
SELECT count(*)
  FROM pg_ls_dir('pg_xlog')
 WHERE pg_ls_dir ~ '^[0-9A-F]{24}$';

-- can also count the files physically present in $DBDIR/pg_wal
-- /bin/ls -l $DBDIR/pg_wal | grep -c '^-'
9. Ready-to-archive WAL file count
When WAL archiving is enabled, PostgreSQL invokes a user script each time a new WAL file is generated. The script is supposed to “archive” the single WAL file it was invoked for (it typically copies it to another server or an S3 bucket). If the script takes too long to do its job, or if it fails, the set of WAL files to be archived piles up.
Action: Continuously monitor WAL ready-to-archive file count, alert if value exceeds a set threshold.
How To:
-- returns the number of WAL files ready to be archived (v12+)
SELECT count(*)
  FROM pg_ls_archive_statusdir()
 WHERE name ~ '^[0-9A-F]{24}.ready$';

-- same, for v10+
SELECT count(*)
  FROM pg_ls_dir('pg_wal/archive_status')
 WHERE pg_ls_dir ~ '^[0-9A-F]{24}.ready$';

-- same, for v9.x
SELECT count(*)
  FROM pg_ls_dir('pg_xlog/archive_status')
 WHERE pg_ls_dir ~ '^[0-9A-F]{24}.ready$';

-- can also count the *.ready files physically present in $DBDIR/pg_wal/archive_status
-- /bin/ls -l $DBDIR/pg_wal/archive_status | grep -c .ready
Collecting These Metrics
The sections above provide SQL statements to extract the needed metrics from a running Postgres server. If you’d rather not write the scripts yourself, check out the open source tool pgmetrics. It can collect the metrics above, and more, and report them in text and JSON formats.
You can directly send the pgmetrics reports to our commercial offering, pgDash, which stores and processes these reports to display graphs and perform alerting.
Next Up
Further parts in this series will cover database-level, table-level, index-level and system-level metrics. Stay tuned!
About pgDash
pgDash is a modern, in-depth monitoring solution designed specifically for PostgreSQL deployments. pgDash shows you information and metrics about every aspect of your PostgreSQL database server, collected using the open-source tool pgmetrics.
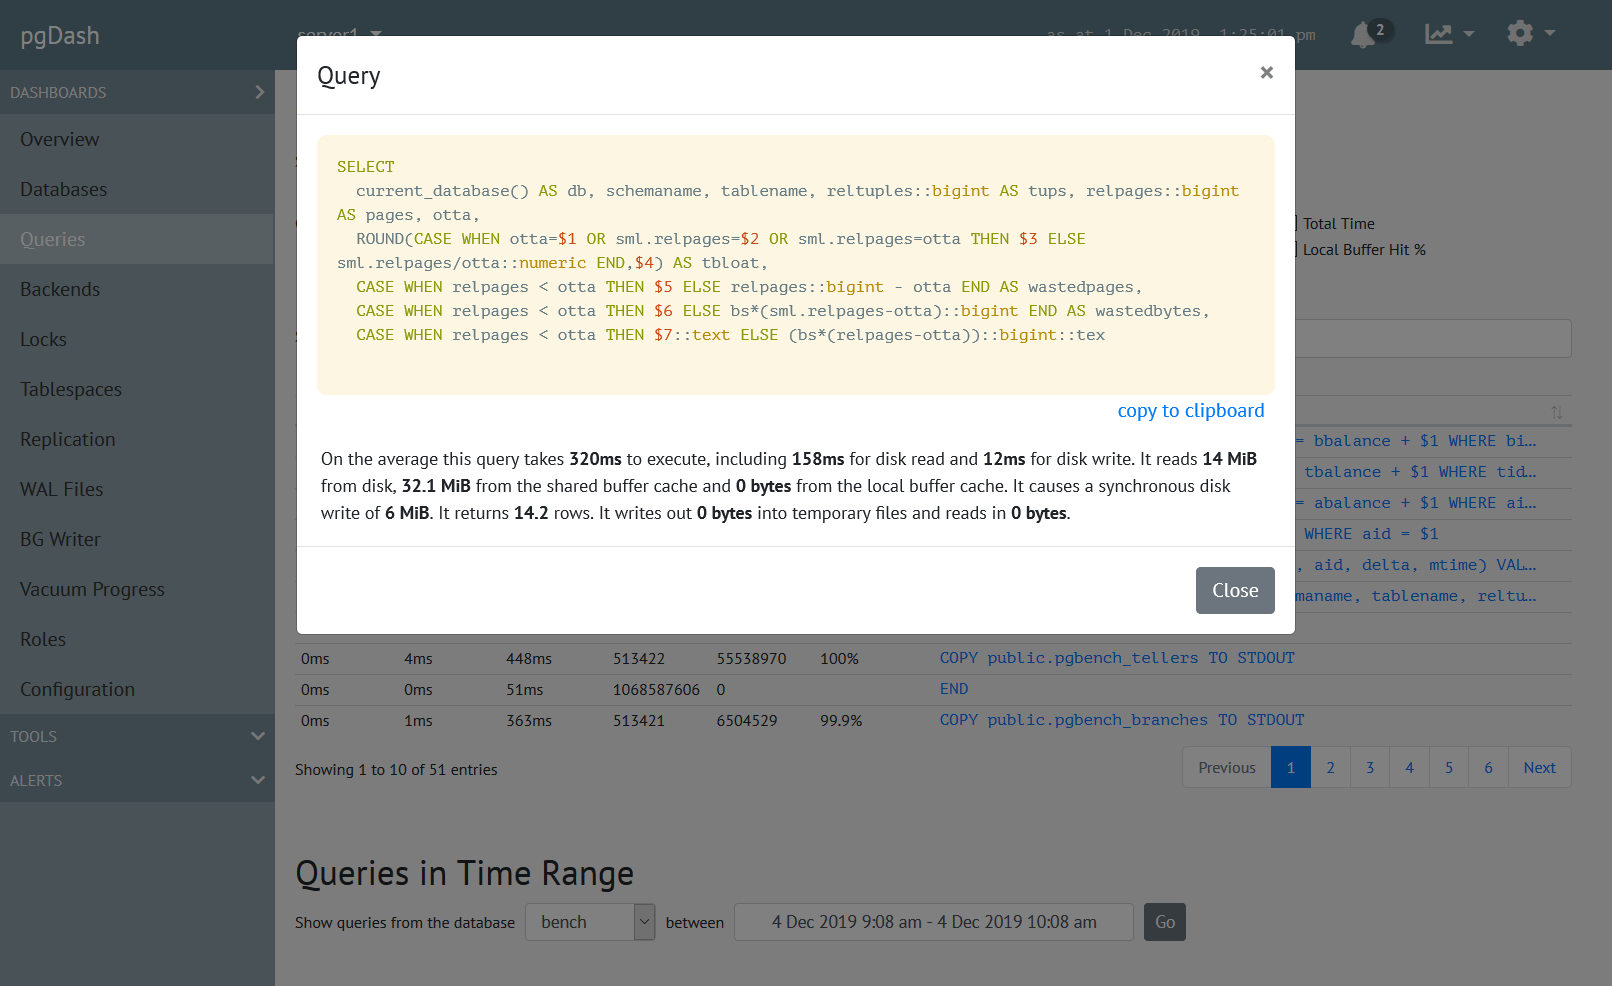
pgDash provides core reporting and visualization functionality, including collecting and displaying PostgreSQL information and providing time-series graphs, detailed reports, diagnostics, alerting, teams and more. Checkout the features here or signup today for a free trial.