Every RDBMS supports indexes, and PostgreSQL is no exception. All large, complex and evolving PostgreSQL database deployments also have unused indexes. Read on to learn why they are bad and how you can find them.
Are Unused Indexes Bad?
Unused indexes are indexes that are not accessed by Postgres to execute any query. Are they bad? In short – yes.
Appropriate indexes can speed up queries, sometimes dramatically so. There is however a cost for ensuring that the data in the indexes of a table correctly reflect the current data in the table. This cost is directly passed on to the application during table data modification operations. Schema migration can also require additional design-time effort and execution downtime when there are more indexes. There are also operational costs, including provisioning disk space, managing bloat, managing replication and so on.
An index that is unused comes with all these costs, and no benefits.
Here is a quick illustration to help you get a feel for some of these costs. Consider two tables of the same column types, one with 3 unique indexes, and other with none:
create table withidx (a int, b int, c int);
create unique index idx_a on withidx(a);
create unique index idx_b on withidx(b);
create unique index idx_c on withidx(c);

create table noidx (a int, b int, c int);
When inserting the same data into both the tables, it takes ~4x more time to add data to the table with indexes.
postgres=# insert into withidx select a, a, a from generate_series(1,100000) as s(a);
INSERT 0 100000
Time: 348.265 ms

postgres=# insert into noidx select a, a, a from generate_series(1,100000) as s(a);
INSERT 0 100000
Time: 79.844 ms
Updates are also similarly affected:
postgres=# update withidx set b=b+1000000;
UPDATE 100000
Time: 555.472 ms

postgres=# update noidx set b=b+1000000;
UPDATE 100000
Time: 134.931 ms
The table with indexes take up more disk space (21 MB, including table and 3 indexes) as opposed to the one without indexes (8.6 MB).
postgres=# select pg_size_pretty(pg_total_relation_size('withidx'::regclass::oid)),
postgres-#        pg_size_pretty(pg_total_relation_size('noidx'::regclass::oid));
 pg_size_pretty | pg_size_pretty
----------------+----------------
 21 MB          | 8688 kB
(1 row)
Note that this is only an illustration, the numbers are not to be taken as a benchmark. The exact overhead depends on the server, the server’s current load, the query, the data, the Postgres version and probably a few more things. There will, however, be a measurable overhead for maintaining indexes.
Why Do Indexes Become Unused?
Large databases typically have a life of their own. Many applications come, go and evolve, the Postgres server gets upgraded, configuration settings get tuned, hardware gets replaced, tables get restructured, and the queries, data and access patterns change.
The decision whether to use a certain index for a certain query is taken by PostgreSQL’s query planner, based on:
- it’s heuristics and algorithm – which may itself have changed as a result of Postgres version upgrades
- configuration settings – which may or may not have been tuned for current hardware
- statistics of the data in the table – which may have changed over time since the index was created
- the cost of using the index – using other, newer indexes or table scans would be cheaper
Over multiple releases of the applications that use the database, the original queries for which the index was created might itself not be executed anymore or anywhere as frequently. The application itself might have been refactored or rewritten with a new stack, a new ORM or totally new technology.
In theory it is possible to review each query of each application against the actual data in the database and decide on the optimal set of indexes. In practice, for large, long-lived databases in organizations with larger teams, it is nearly impossible. From a database operations point of view, it is more practical to include regular review and possible deletion of existing indexes as a maintenance task.
Finding Unused Indexes In Postgres v15 And Earlier
In all the current production versions of PostgreSQL, it is not possible to directly find indexes that have not been used for a given period of time. That is to say, there is no query or method to immediately return a list of indexes that have not been used for any query between now and an earlier point in time.
Postgres does give us the statistic of the number of times an index has been scanned. This is available in the system catalog statistics view pg_stat_user_indexes as the column idx_scan:
postgres=# select schemaname || '.' || indexrelname as index, idx_scan
postgres-#   from pg_stat_user_indexes;
    index     | idx_scan
--------------+----------
 public.idx_a |        0
 public.idx_b |        0
 public.idx_c |        0
(3 rows)
The value is initially 0 after the index has been created. After running a query that will use the index, we can see that the scan count for that index increases:
postgres=# select a from withidx where a=10;
 a
----
 10
(1 row)

postgres=# select schemaname || '.' || indexrelname as index, idx_scan
postgres-#   from pg_stat_user_indexes;
    index     | idx_scan
--------------+----------
 public.idx_a |        1
 public.idx_b |        0
 public.idx_c |        0
(3 rows)

postgres=# select a from withidx where a=20;
 a
----
 20
(1 row)

postgres=# select schemaname || '.' || indexrelname as index, idx_scan
             from pg_stat_user_indexes;
    index     | idx_scan
--------------+----------
 public.idx_a |        2
 public.idx_b |        0
 public.idx_c |        0
(3 rows)
This per-index scan count can be used, over time, to determine if an index has been unused for a certain duration. Specifically, this involves storing the per-index scan count as a time series.
Here is an example of how to go about this. Let’s make a table to store this scan count information, with each row containing the scan count of a certain index at a certain time:
postgres=# create table index_scans (at timestamptz, name text, scans int);
CREATE TABLE
We can populate it with the current statistics using an INSERT..SELECT:
postgres=# insert into index_scans
postgres-# select now(),
postgres-#        schemaname || '.' || indexrelname as index, idx_scan
postgres-#   from pg_stat_user_indexes;
INSERT 0 3

postgres=# table index_scans;
                at                |     name     | scans
----------------------------------+--------------+-------
 2023-06-26 14:46:49.877473+05:30 | public.idx_a |     2
 2023-06-26 14:46:49.877473+05:30 | public.idx_b |     0
 2023-06-26 14:46:49.877473+05:30 | public.idx_c |     0
(3 rows)
By doing this periodically at regular intervals while queries are running, we can build up a time series of per-index scan counts:
postgres=# table index_scans;
                at                |     name     | scans
----------------------------------+--------------+-------
 2023-06-26 14:46:49.877473+05:30 | public.idx_a |     2
 2023-06-26 14:46:49.877473+05:30 | public.idx_b |     0
 2023-06-26 14:46:49.877473+05:30 | public.idx_c |     0
 2023-06-26 14:48:03.061833+05:30 | public.idx_a |    10
 2023-06-26 14:48:03.061833+05:30 | public.idx_b |     0
 2023-06-26 14:48:03.061833+05:30 | public.idx_c |     0
(6 rows)
To determine if a certain index, say public.idx_a, has been unused in the last 7 days, we first determine the first and last data points available during this window..
postgres=# select min(at), max(at)
postgres-#   from index_scans
postgres-#  where name = 'public.idx_a' and at > now() - interval '7 days';
               min                |               max
----------------------------------+----------------------------------
 2023-06-26 14:46:49.877473+05:30 | 2023-06-26 14:48:03.061833+05:30
(1 row)
..and get the scan counts at these two timestamps:
postgres=# select at, scans
postgres-#   from index_scans
postgres-#  where name = 'public.idx_a'
postgres-#    and at in ('2023-06-26 14:46:49.877473+05:30', '2023-06-26 14:48:03.061833+05:30');
                at                | scans
----------------------------------+-------
 2023-06-26 14:46:49.877473+05:30 |     2
 2023-06-26 14:48:03.061833+05:30 |    10
(2 rows)
The scan count has increased between the two timestamps, so we can state that the index has indeed been used during this interval. Had the counts been the same, we can instead conclude that the index was unused.
This is the method that pgDash also uses, although it does not store the time series in Postgres itself. Here is the UI that lists out unused indexes for a given duration:
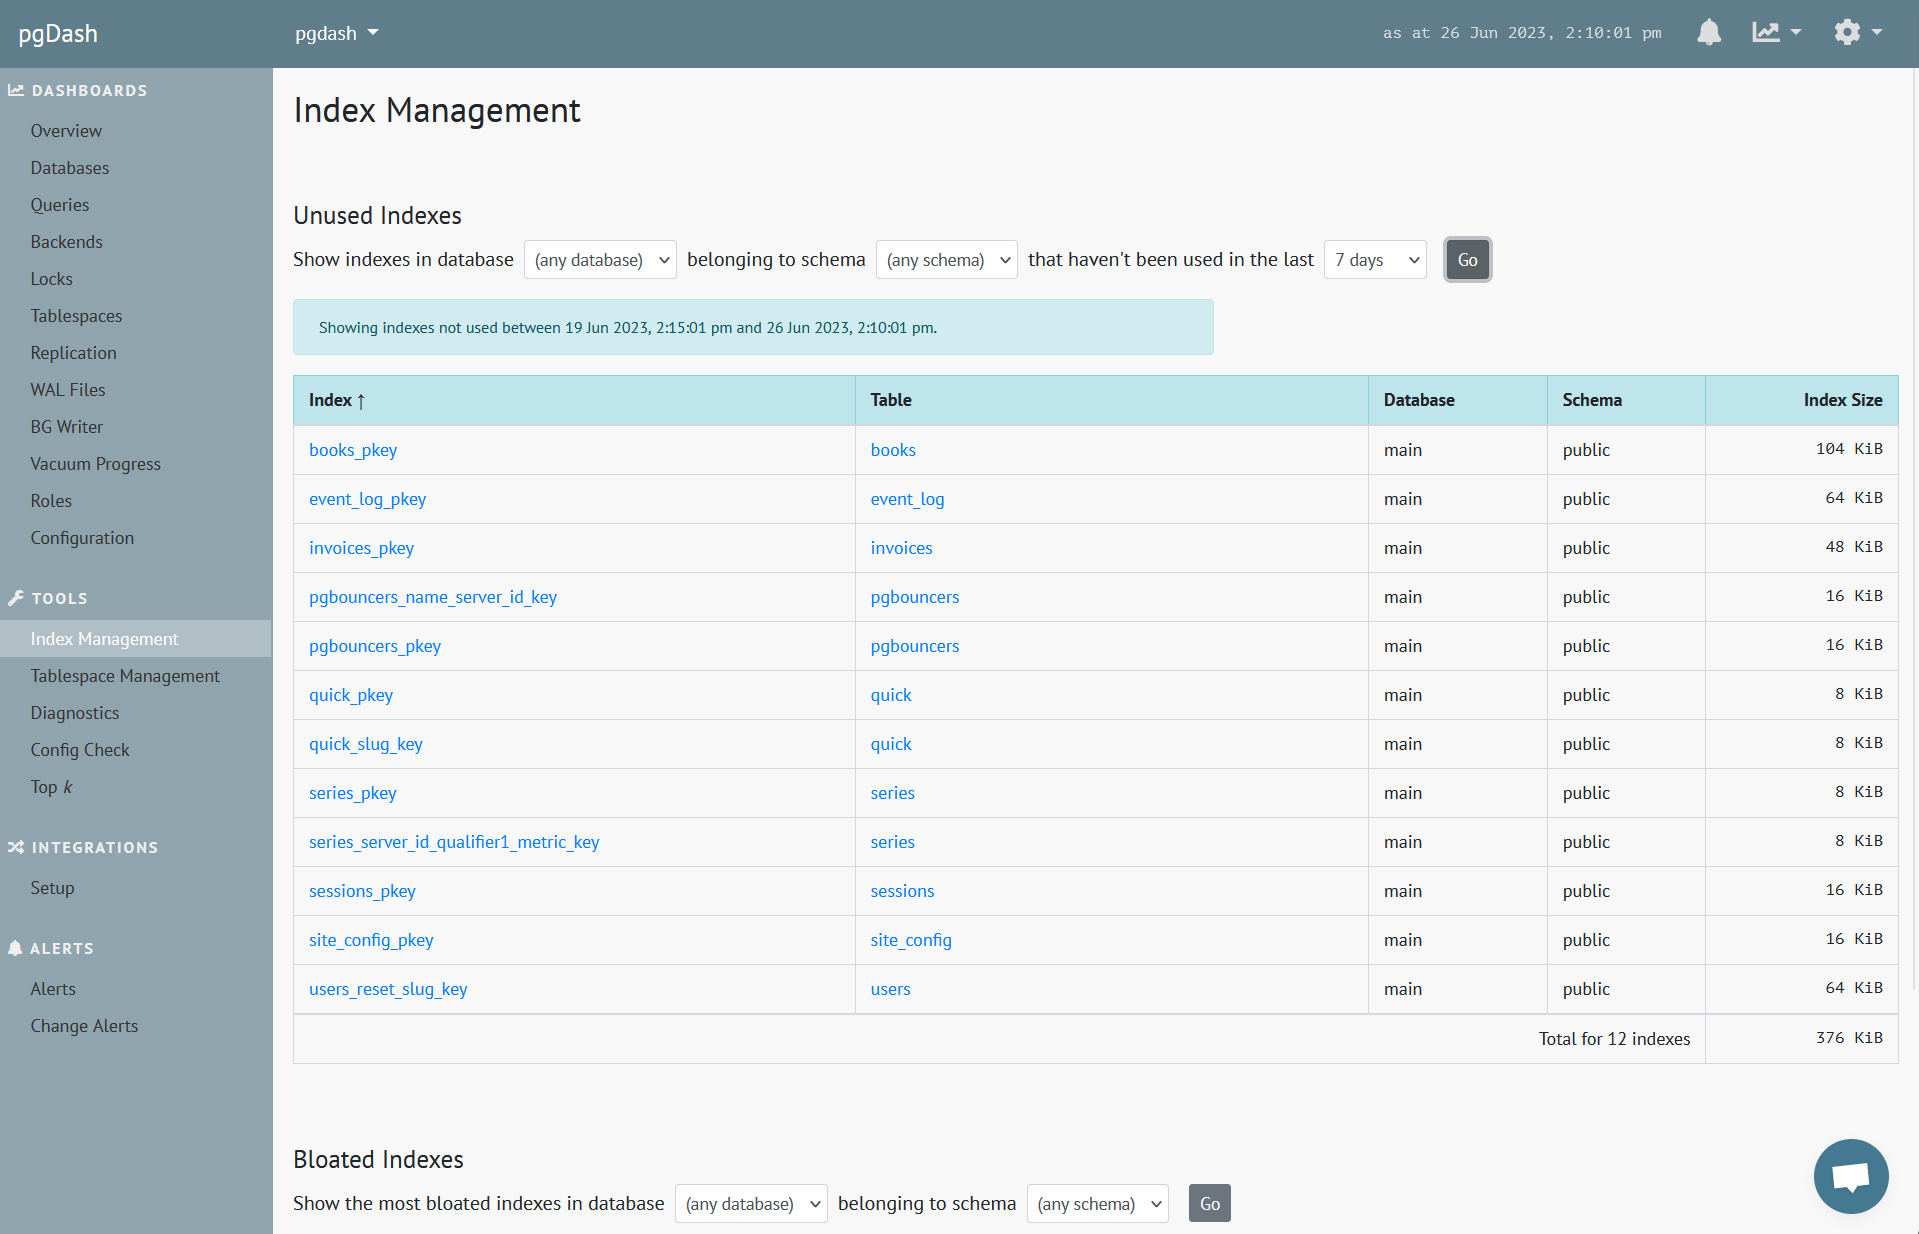
A simpler approach is to reset the statistics using pg_stat_reset(), wait for, say a week, and see which indexes have idx_scan still as 0. This works, but has the unfortunate side effect of obliterating every statistic of the database.
Finding Unused Indexes In Postgres v16
Fortunately, finding unused indexes in PostgreSQL version 16 is promising to be much simpler. (Note that Postgres 16 is still in beta, but the feature described in this section should in all likelihood be present in the final release.)
In Postgres 16, the pg_stat_user_indexes system view has a new column called last_idx_scan, which contains the timestamp of the last scan of the index:
postgres=# select schemaname || '.' || indexrelname as index, idx_scan, last_idx_scan
postgres-#   from pg_stat_user_indexes;
    index     | idx_scan | last_idx_scan
--------------+----------+---------------
 public.idx_a |        0 |
 public.idx_b |        0 |
 public.idx_c |        0 |
(3 rows)

postgres=# select a from withidx where a=10;
 a
----
 10
(1 row)

postgres=# select schemaname || '.' || indexrelname as index, idx_scan, last_idx_scan
postgres-#   from pg_stat_user_indexes;
    index     | idx_scan |          last_idx_scan
--------------+----------+----------------------------------
 public.idx_a |        1 | 2023-06-26 14:06:22.697064+05:30
 public.idx_b |        0 |
 public.idx_c |        0 |
(3 rows)
And now, just like that, with a single query you can get the list of indexes that have not been used recently!
postgres=# select schemaname || '.' || indexrelname as index, idx_scan, last_idx_scan
             from pg_stat_user_indexes
            where last_idx_scan is null or last_idx_scan < now() - interval '7 days';
    index     | idx_scan | last_idx_scan
--------------+----------+---------------
 public.idx_b |        0 |
 public.idx_c |        0 |
(2 rows)
Needless to say, this is quite an improvement over the current state of affairs, and we are looking forward to incorporating this in pgmetrics and pgDash when Postgres 16 is released.
About pgDash
pgDash is a modern, in-depth monitoring solution designed specifically for PostgreSQL deployments. pgDash shows you information and metrics about every aspect of your PostgreSQL database server, collected using the open-source tool pgmetrics.
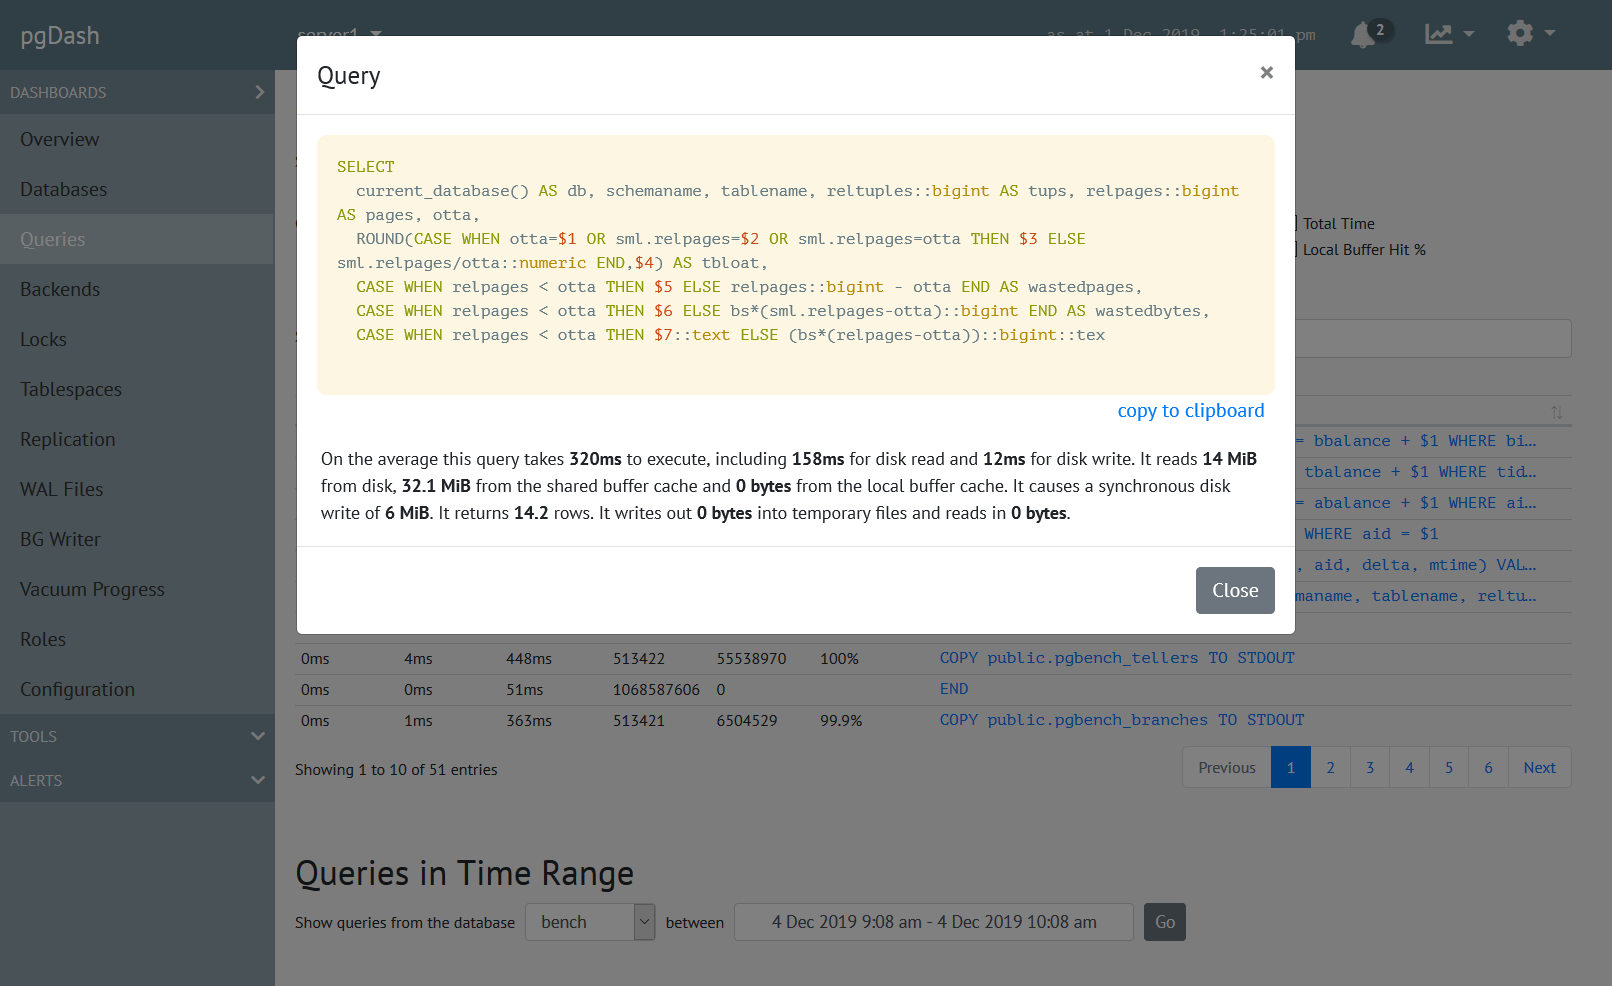
pgDash provides core reporting and visualization functionality, including collecting and displaying PostgreSQL information and providing time-series graphs, detailed reports, diagnostics, alerting, teams and more. Checkout the features here or signup today for a free trial.