Looking to distribute your application’s database SELECT queries across your entire replicated PostgreSQL deployment? Pgpool is a quick and easy solution to this problem. Read on to learn more.
Why Distribute SELECT Queries?
Most applications are designed to connect to a single database server. In reality, the “single database server” is often a proxy fronting more than one database server. The proxy routes queries to different servers to improve performance, minimize query times and implement high availability.
Streaming replication is the modern standard way to replicate a single PostgreSQL database server (technically a database cluster) onto other VMs or physical machines in real-time. Each such replicated cluster contains data exactly identical to the original (aka primary) cluster insofar as network delays and CPU loads allow for. Given this, it makes sense to distribute read-only or SELECT queries across all the replicated clusters in order to reduce the load on individual servers.
Pgpool is a PostgreSQL proxy server that can do precisely this (and more). Unlike most other Postgres load balancers or proxies, Pgpool can actually parse queries per the Postgres SQL grammar, and therefore route SELECTs among a set of standbys fairly and effectively.
Setting up Pgpool
Setting up Pgpool involves installing the binary from your Linux distribution’s package manager, or by compiling the latest sources from here.
The Replicated Clusters
The rest of this blog post assumes that there is a set of (replicated) PostgreSQL
clusters, with the primary at 127.0.0.1:10001 (“cluster1”), and two standbys
at 127.0.0.1:10002 (“cluster2”) and 127.0.0.1:10003 (“cluster3”).
There are two things that are required in this deployment for the proper operation of Pgpool:
- Application name: Each standby is identified by a unique
application_namein it’sprimary_conninfosetting. It is a best practice to identify each application that connects to your database using a uniqueapplication_name, so this should not be much of a problem. The standby itself makes a single connection to the primary, and the standby’s application name is visible at the primary aspg_stat_activity.application_name. Theprimary_conninfofor a standby clustercluster2looks like this:
primary_conninfo = 'application_name=cluster2 user=foo host=server2 port=10002 ...'
- Pgpool user: Pgpool itself needs to connect to all the Postgres clusters to
monitor health and replication. It is best to create a dedicated user for this.
The user should be granted the
pg_monitorrole (Postgres v10+). The role creation looks like this:
CREATE USER pgpool;
GRANT pg_monitor TO pgpool;
Pgpool Configuration
Pgpool relies on a single pgpool.conf file for it’s configuration. The Pgpool
distribution comes with a sample configuration that you can copy for further
editing:
$ mkdir ~/pgpool
$ cp /usr/share/pgpool2/pgpool.conf ~/pgpool/pgpool.conf
The actual location of the sample configuration depends on your Linux distribution, whether you are installing from the sources etc.
Let’s make the following changes:
listen_address = '*'
port           = 11000

pid_file_name = '/tmp/pgpool.pid'

backend_hostname0         = '127.0.0.1'
backend_port0             = 10001
backend_weight0           = 0
backend_application_name0 = 'cluster1'

backend_hostname1         = '127.0.0.1'
backend_port1             = 10002
backend_weight1           = 0.5
backend_application_name1 = 'cluster2'

backend_hostname2         = '127.0.0.1'
backend_port2             = 10003
backend_weight2           = 0.5
backend_application_name2 = 'cluster3'

sr_check_period           = 10
sr_check_user             = 'pgpool'

health_check_period       = 10
health_check_user         = 'pgpool'
This is what these entries mean:
- Pgpool will listen on all network interfaces on port 11000 for incoming PostgreSQL connections – this is what the clients will connect to.
- The PID file of Pgpool will be stored at
/tmp/pgpool.pid(the user running the pgpool binary may not have permissions for the default value of/var/run/pgpool/pgpool.pid) - The 3 PostgreSQL servers of the deployment are configured. Pgpool will
figure out which is the primary and which are the standbys. The ‘weight’
of the first cluster (the primary) is set to
0, which means no SELECT queries will be routed to the primary. The other two have weights of0.5, which means they will each receive 50% of the SELECT queries. - Streaming replication checks will be performed every 10 seconds. Pgpool will connect as the user pgpool and run queries to check streaming replication status. Any other necessary authentication parameters must also be set (refer to the pgpool documentation for more details.)
- Health checks will be performed every 10 seconds. Pgpool will connect as the user pgpool and run queries to check health status. Any other necessary authentication parameters must also be set (refer to the pgpool documentation for more details.)
Running Pgpool
Once configured, we can run pgpool in the foreground as:
$ pgpool -f /path/to/pgpool.conf -n
The -n flag instructs Pgpool to run in the foreground until interrupted with ^C
and print log messages to the console. This is perfect for experimenting with Pgpool.
After it starts up, you can connect to Pgpool at port 11000 and check it’s
status:
$ psql -h /tmp -p 11000 postgres
psql (15.4 (Debian 15.4-1.pgdg110+1))
Type "help" for help.

postgres=# show pool_nodes;
-[ RECORD 1 ]----------+--------------------
node_id                | 0
hostname               | 127.0.0.1
port                   | 10001
status                 | up
pg_status              | up
lb_weight              | 0.000000
role                   | primary
pg_role                | primary
select_cnt             | 0
load_balance_node      | false
replication_delay      | 0
replication_state      |
replication_sync_state |
last_status_change     | 2023-09-05 09:57:43
-[ RECORD 2 ]----------+--------------------
node_id                | 1
hostname               | 127.0.0.1
port                   | 10002
status                 | up
pg_status              | up
lb_weight              | 0.500000
role                   | standby
pg_role                | standby
select_cnt             | 0
load_balance_node      | true
replication_delay      | 0
replication_state      | streaming
replication_sync_state | async
last_status_change     | 2023-09-05 09:57:43
-[ RECORD 3 ]----------+--------------------
node_id                | 2
hostname               | 127.0.0.1
port                   | 10003
status                 | up
pg_status              | up
lb_weight              | 0.500000
role                   | standby
pg_role                | standby
select_cnt             | 0
load_balance_node      | false
replication_delay      | 0
replication_state      | streaming
replication_sync_state | async
last_status_change     | 2023-09-05 09:57:43
This shows that Pgpool knows about 3 PostgreSQL servers (backends), all of
which are up, one is a primary and the rest are standbys. The 0s in the select_cnt fields
indicate that no SELECT statements have been issued so far against any node.
Let’s create a new table in the default database:
$ psql -h /tmp -p 11000 postgres
psql (15.4 (Debian 15.4-1.pgdg110+1))
Type "help" for help.

postgres=# create table foo (a int);
CREATE TABLE
postgres=#
The command SHOW pool_backend_stats can be used to see the counts of the different
types of queries that have been executed so far against each backend. The result
shows that one DDL command (ddl_cnt = 1) has been executed against the primary
and none against the standbys. Pgpool is smart enough to direct the DDL command
to the primary.
postgres=# show pool_backend_stats;
-[ RECORD 1 ]---------
node_id    | 0
hostname   | 127.0.0.1
port       | 10001
status     | up
role       | primary
select_cnt | 0
insert_cnt | 0
update_cnt | 0
delete_cnt | 0
ddl_cnt    | 1
other_cnt  | 2
panic_cnt  | 0
fatal_cnt  | 0
error_cnt  | 0
-[ RECORD 2 ]---------
node_id    | 1
hostname   | 127.0.0.1
port       | 10002
status     | up
role       | standby
select_cnt | 0
insert_cnt | 0
update_cnt | 0
delete_cnt | 0
ddl_cnt    | 0
other_cnt  | 1
panic_cnt  | 0
fatal_cnt  | 0
error_cnt  | 0
-[ RECORD 3 ]---------
node_id    | 2
hostname   | 127.0.0.1
port       | 10003
status     | up
role       | standby
select_cnt | 0
insert_cnt | 0
update_cnt | 0
delete_cnt | 0
ddl_cnt    | 0
other_cnt  | 1
panic_cnt  | 0
fatal_cnt  | 0
error_cnt  | 0
Now let’s run a few (100) SELECT commands and see how Pgpool routes them:
for i in `seq 1 100` ; do psql -h /tmp -p 11000 -c 'select count(*) from foo' postgres ; done
By running SHOW pool_nodes again, we can check the select_cnt for each
backend to see which ones serviced the queries:
postgres=# show pool_nodes;
-[ RECORD 1 ]----------+--------------------
node_id                | 0
hostname               | 127.0.0.1
port                   | 10001
status                 | up
pg_status              | up
lb_weight              | 0.000000
role                   | primary
pg_role                | primary
select_cnt             | 0
load_balance_node      | false
replication_delay      | 0
replication_state      |
replication_sync_state |
last_status_change     | 2023-09-05 09:57:43
-[ RECORD 2 ]----------+--------------------
node_id                | 1
hostname               | 127.0.0.1
port                   | 10002
status                 | up
pg_status              | up
lb_weight              | 0.500000
role                   | standby
pg_role                | standby
select_cnt             | 48
load_balance_node      | false
replication_delay      | 0
replication_state      | streaming
replication_sync_state | async
last_status_change     | 2023-09-05 09:57:43
-[ RECORD 3 ]----------+--------------------
node_id                | 2
hostname               | 127.0.0.1
port                   | 10003
status                 | up
pg_status              | up
lb_weight              | 0.500000
role                   | standby
pg_role                | standby
select_cnt             | 52
load_balance_node      | true
replication_delay      | 0
replication_state      | streaming
replication_sync_state | async
last_status_change     | 2023-09-05 09:57:43
The primary has a select_cnt of 0 while the others have counts of 48 and
52, showing that Pgpool successfully managed to route the SELECT queries mostly
evenly between the two standbys!
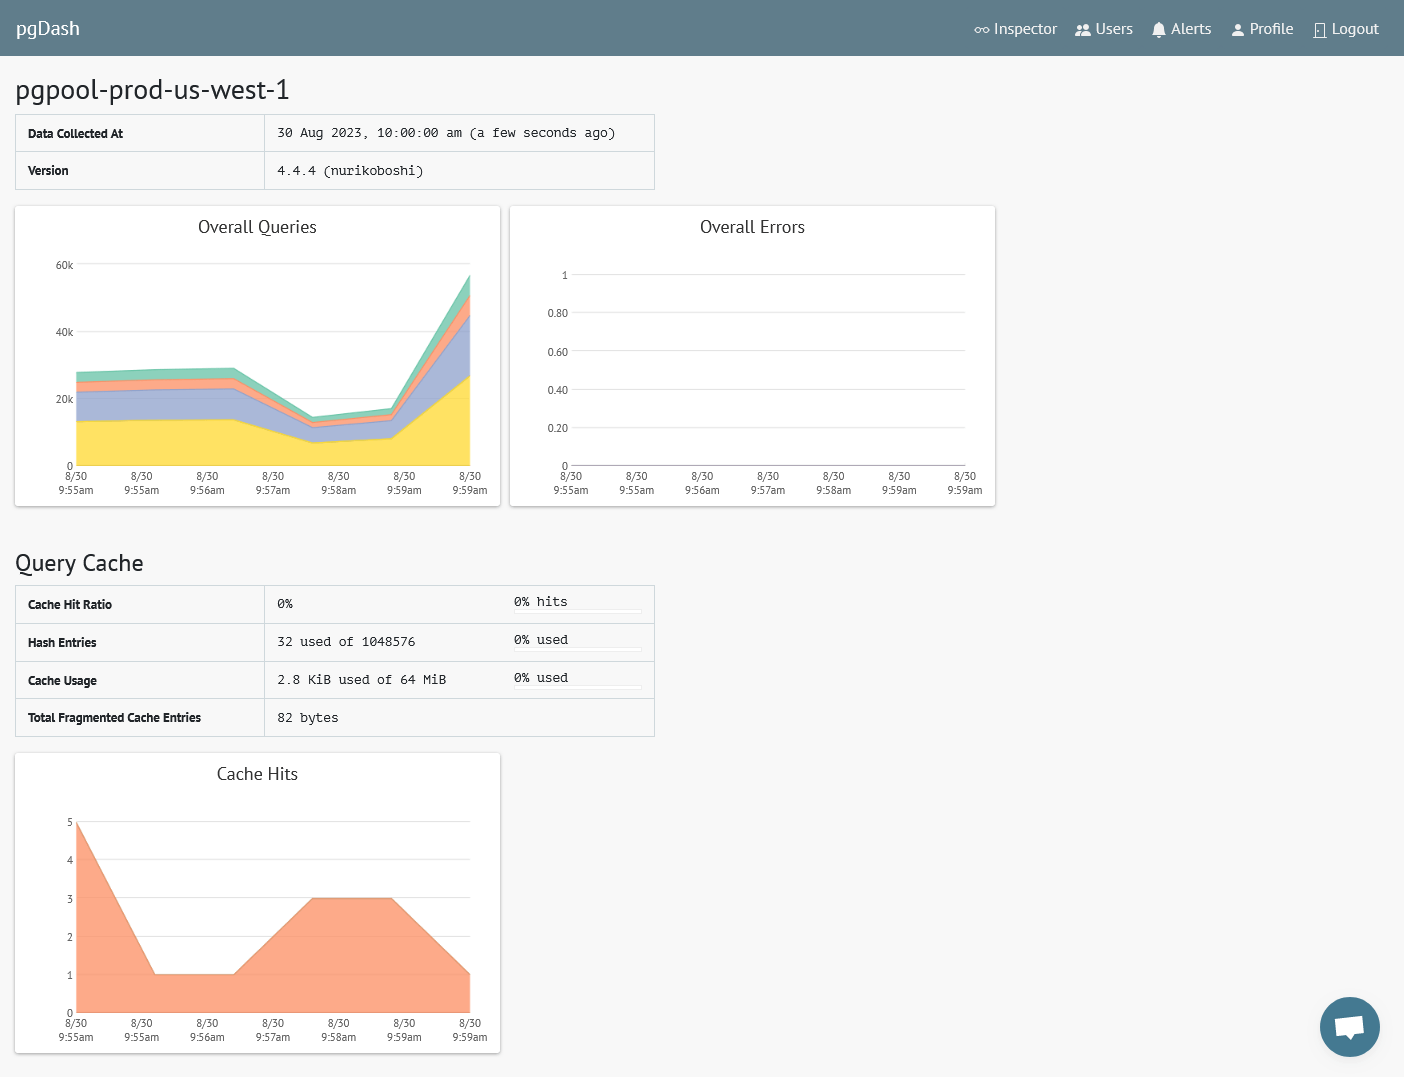
Monitoring With pgDash
pgDash supports monitoring of PgPool instances. You can monitor overall status and the status of in-memory query cache:
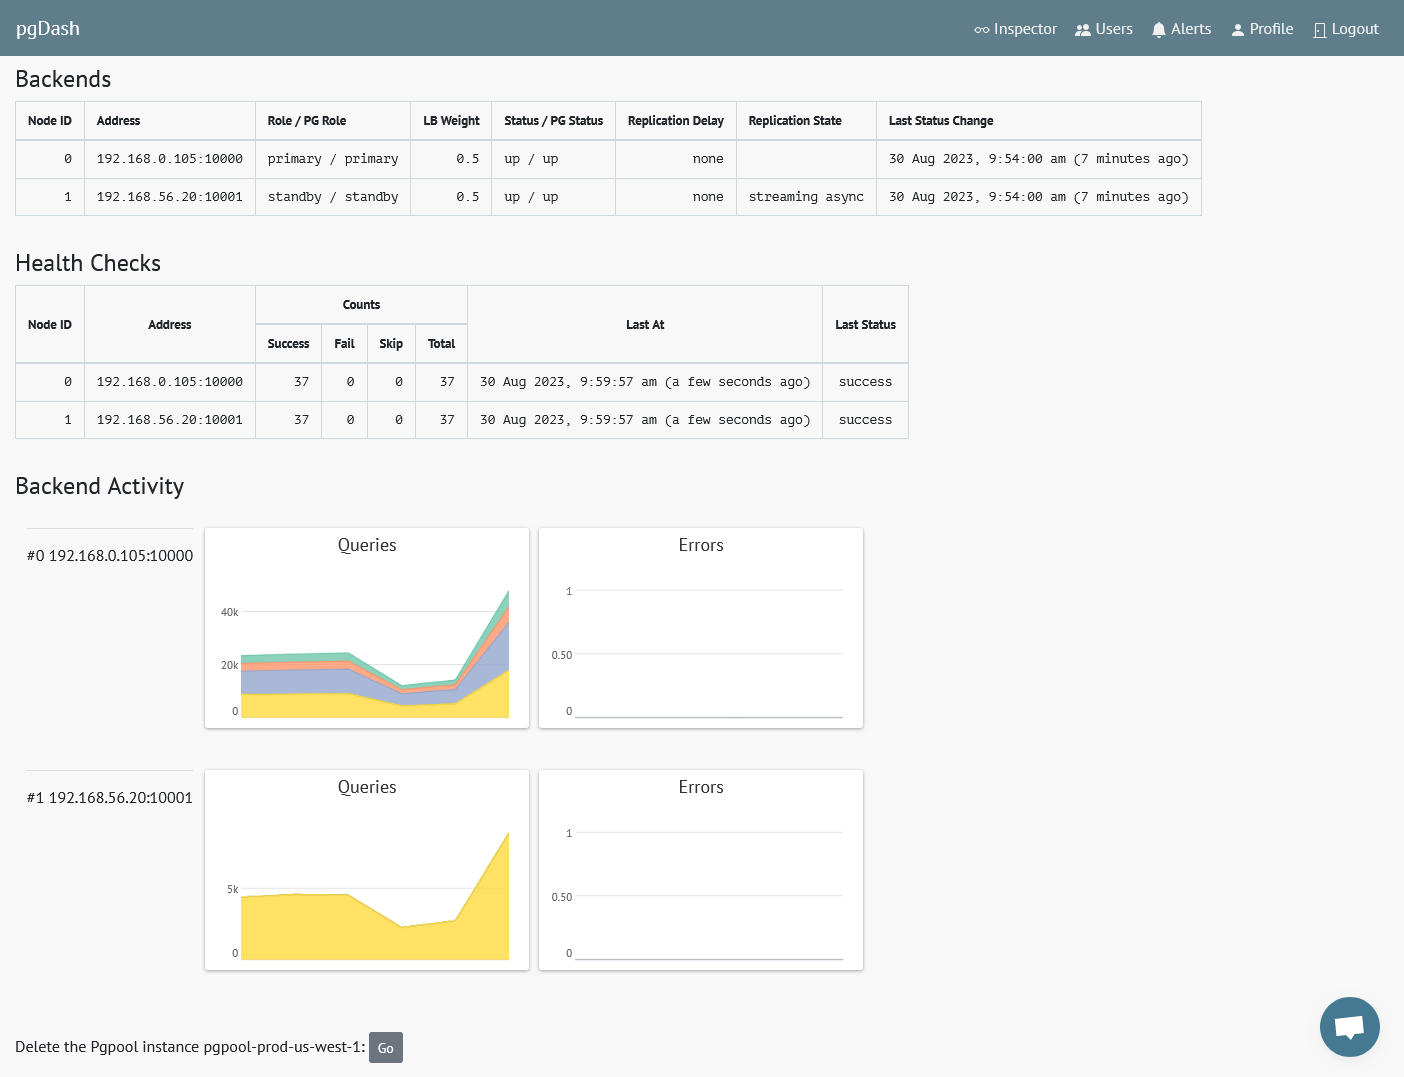
The per-backend statistics and health check status can also be monitored:
For more information about Pgpool monitoring using pgDash, see here.
Next Steps
Pgpool can do more than just load balancing. It can also, for example, cache the results of a query in-memory, or in a memcache server, and return the query result from the cache. It can provide a highly-available endpoint when standbys go down.
For more information, check out the Pgpool documentation.
About pgDash
pgDash is a modern, in-depth monitoring solution designed specifically for PostgreSQL deployments. pgDash shows you information and metrics about every aspect of your PostgreSQL database server, collected using the open-source tool pgmetrics.
pgDash provides core reporting and visualization functionality, including collecting and displaying PostgreSQL information and providing time-series graphs, detailed reports, diagnostics, alerting, teams and more. Checkout the features here or signup today for a free trial.