Hello Readers! “The Monday Elephant” is a weekly PostgreSQL blog post series that brings you tips, tricks and tools to help you be more productive with PostgreSQL database administration.
Sometimes you want to cache the results of an expensive SELECT query in PostgreSQL. Maybe it is an analytics query that only needs to be “reasonably” up-to-date – for example a “top 10 best-selling products in each category” dashboard query that is sufficient to be updated on the hour. Or sometimes you want to cache the results of a simple, deterministic query over static data that is being executed an unreasonable number of times by application logic.
Here are a few ways to do this.
Materialized Views
The simplest way is to use PostgreSQL’s built-in materialized views. For our query of “top 10 best-selling products in each category”, say we have this SQL query:
SELECT category_name, product_name, total_units_sold, sales_rank
FROM (
    SELECT
        c.name AS category_name,
        p.name AS product_name,
        SUM(s.quantity) AS total_units_sold,
        DENSE_RANK() OVER (
            PARTITION BY c.id
            ORDER BY SUM(s.quantity) DESC
        ) as sales_rank
    FROM sales s
    JOIN products p ON s.product_id = p.id
    JOIN categories c ON p.category_id = c.id
    GROUP BY c.id, c.name, p.name
) AS ranked_products
WHERE sales_rank <= 10
ORDER BY category_name, sales_rank;
which sums up total sales of products over each category and lists the top 10 in each category ordered by this sum.
To avoid the marketing team’s dashboard code running this query every time a team member refreshes the page, you can provide the results through a materialized view:
CREATE MATERIALIZED VIEW mv_category_top_sellers AS
  -- [insert the query above here]
WITH DATA;
Then the query for the dashboard becomes:
SELECT * FROM mv_category_top_sellers;
To update the results periodically, refresh the view with the command:
REFRESH MATERIALIZED VIEW mv_category_top_sellers;
The refreshing of the view cannot be automatically scheduled from within base PostgreSQL. There are two popular extensions, pg_cron and pg_timetable, that allow cron-like scheduling of SQL commands. If installing an extension on the server is technically simple and bureaucratically nightmarish, you can always just setup an actual cron job that does:
/usr/bin/psql -h myhost -U myuser -c 'REFRESH MATERIALIZED VIEW mv_category_top_sellers' mydb
PgPool
PgPool is a battle-tested load-balancing and caching software that can sit between the application and your PostgreSQL server. It comes with a built-in query caching facility. This is documented in detail here. Using the caching feature of PgPool is an easy option if you’re already using PgPool in your deployment.
ellycache
ellycache is an open-source, standalone, zero-dependency tool that can cache the results of PostgreSQL queries. The results are made available through HTTP that can be easily retrieved through HTTP GETs. The caching itself can be in-memory or on encrypted on-disk files.
ellycache enforces a cron-like schedule for queries – they are run only on schedule, and not when demanded by HTTP requests. This ensures the traffic between ellycache and PostgreSQL is entirely deterministic and therefore controllable.
To use ellycache for caching, start it with a configuration file like this:
listen = ":8080"

connection {
        dsn = "host=myhost port=myport user=myuser password=mypass dbname=mydb"
}

endpoint "/marketing/dashboard/top-10-prods-by-cat" {
        sql = <<TOP10
--the query goes here
TOP10

        schedule = "@every 1h"
        atstart = true
}
After startup, you can query the results with:
$ curl -i http://localhost:8080/marketing/dashboard/top-10-prods-by-cat
HTTP/1.1 200 OK
Cache-Control: max-age=59, immutable
Content-Length: 623
Content-Type: application/json
Etag: W/"22ca5aaebb127905"
Last-Modified: Mon, 20 Apr 2026 06:21:00 GMT
Vary: Accept-Encoding
Date: Mon, 20 Apr 2026 06:21:36 GMT

[
  {"category_name":"Clothing","product_name":"Cotton T-Shirt","sales_rank":1,"total_units_sold":971},
  {"category_name":"Clothing","product_name":"Wool Socks","sales_rank":2,"total_units_sold":84},
  {"category_name":"Electronics","product_name":"Wireless Buds","sales_rank":1,"total_units_sold":359},
  {"category_name":"Electronics","product_name":"Smartphone Alpha","sales_rank":2,"total_units_sold":116},
  {"category_name":"Electronics","product_name":"Laptop Pro","sales_rank":3,"total_units_sold":23},
  {"category_name":"Home \u0026 Garden","product_name":"Potting Mix","sales_rank":1,"total_units_sold":2481}
]
You can see that the results are presented as a array of JSON objects (can be configured to be array of arrays also), with headers suitable for caching via a CDN.
For more information about ellycache, see the GitHub page https://github.com/rapidloop/ellycache.
About pgDash
pgDash is a modern, in-depth monitoring solution designed specifically for PostgreSQL deployments. pgDash shows you information and metrics about every aspect of your PostgreSQL database server, collected using the open-source tool pgmetrics.
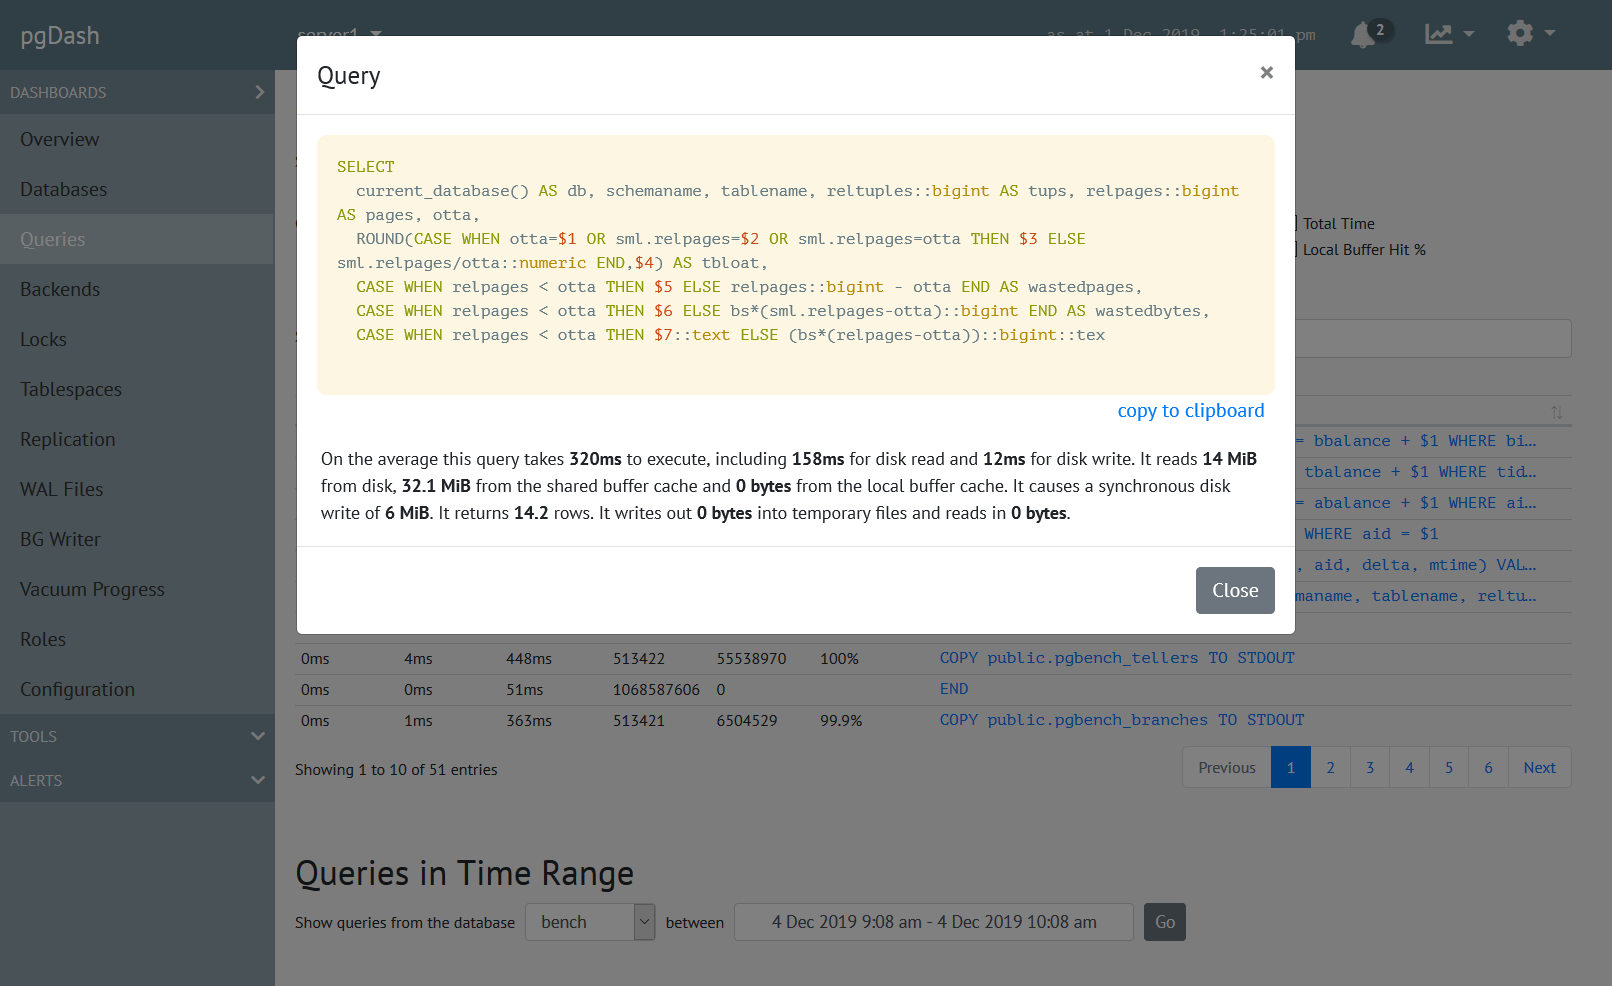
pgDash provides core reporting and visualization functionality, including collecting and displaying PostgreSQL information and providing time-series graphs, detailed reports, diagnostics, alerting, teams and more. Checkout the features here or signup today for a free trial.