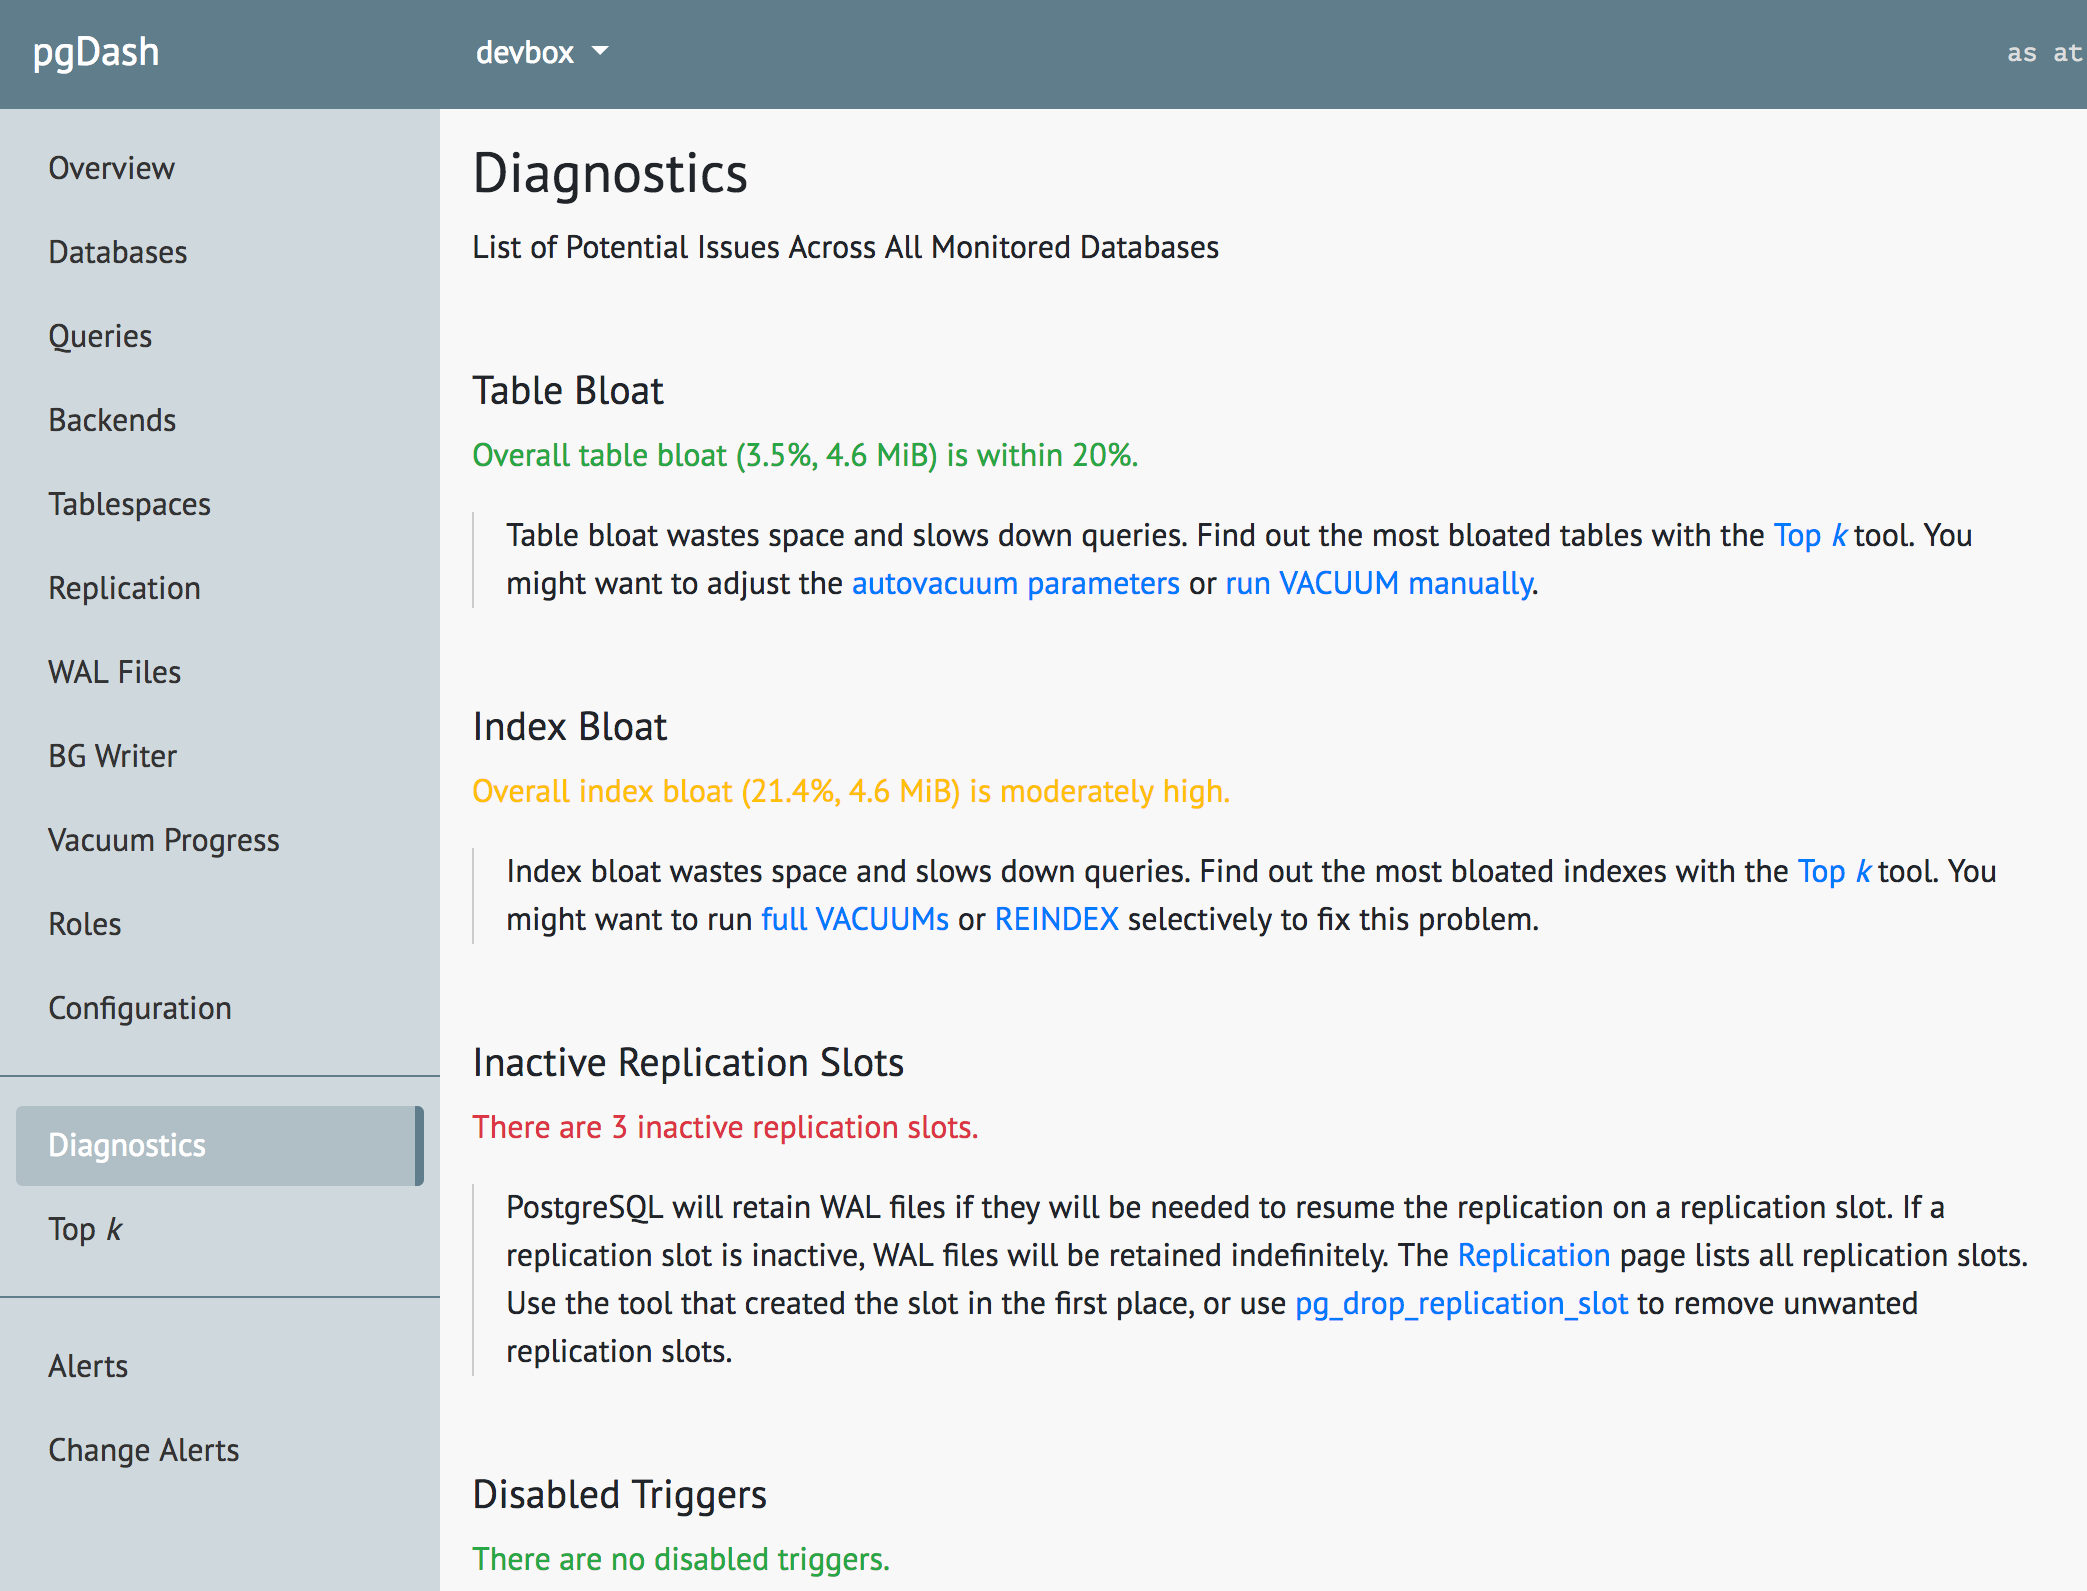
A new Diagnostics feature is now available in pgDash. Diagnostics examines your PostgreSQL server and databases scanning for potential issues that can impact the health and performance of the deployment. No need to spend time collecting info from different sources. pgDash provides a Diagnostic update on key areas of your deployment at a glance. Some of the things that it looks at are:
- Table and index bloat
- Inactive replication slots
- Deadlocks
- Vacuum and analyze status
- Unused indexes
- CPU, memory and disk usage
- and more
To find out more, Signup for a pgDash Free Trial or Login to your pgDash account. No additional setup is required for Diagnostics - you just need to be actively sending in data to pgDash.
About pgDash
pgDash is a modern, in-depth monitoring solution designed specifically for PostgreSQL deployments. pgDash shows you information and metrics about every aspect of your PostgreSQL database server, collected using the open-source tool pgmetrics.
pgDash provides core reporting and visualization functionality, including collecting and displaying PostgreSQL information and providing time-series graphs, detailed reports, alerting, teams and more.