pgDash is a comprehensive monitoring solution designed specifically for PostgreSQL deployments. pgDash provides a number of features to monitor your PostgreSQL deployment including:
In-depth PostgreSQL metrics
pgDash shows you information and metrics about every aspect of your PostgreSQL database server, collected using the open-source tool pgmetrics.
Meaningful Alerts
Set meaningful alerts, like “Commit Ratio of mydb falls below 83%”, “More than 100 backends are waiting on locks”. Notify via email, Slack, and PagerDuty.
Weekly Updates
pgDash also provides a weekly update on key metrics and areas of your pgDash deployment to review, emailed to you for easy review.
You can get up and running with pgDash in about 5 minutes by following the steps in the documentation. Once you’re setup, here are our top recommendations for things to check out as you begin exploring pgDash:
Database Information: View information and trends about database size, commit ratio, deadlocks, transaction id range (to prevent wraparound), disabled triggers, sequences, extensions and more for each database that you’re monitoring with pgDash.
Tablespaces: See disk usage trends for each tablespace. It’s also very easy to set alerts for any or all of these metrics.
Backends: Review information about backends waiting for locks, transactions that are open too long, a particular user’s transactions and more.
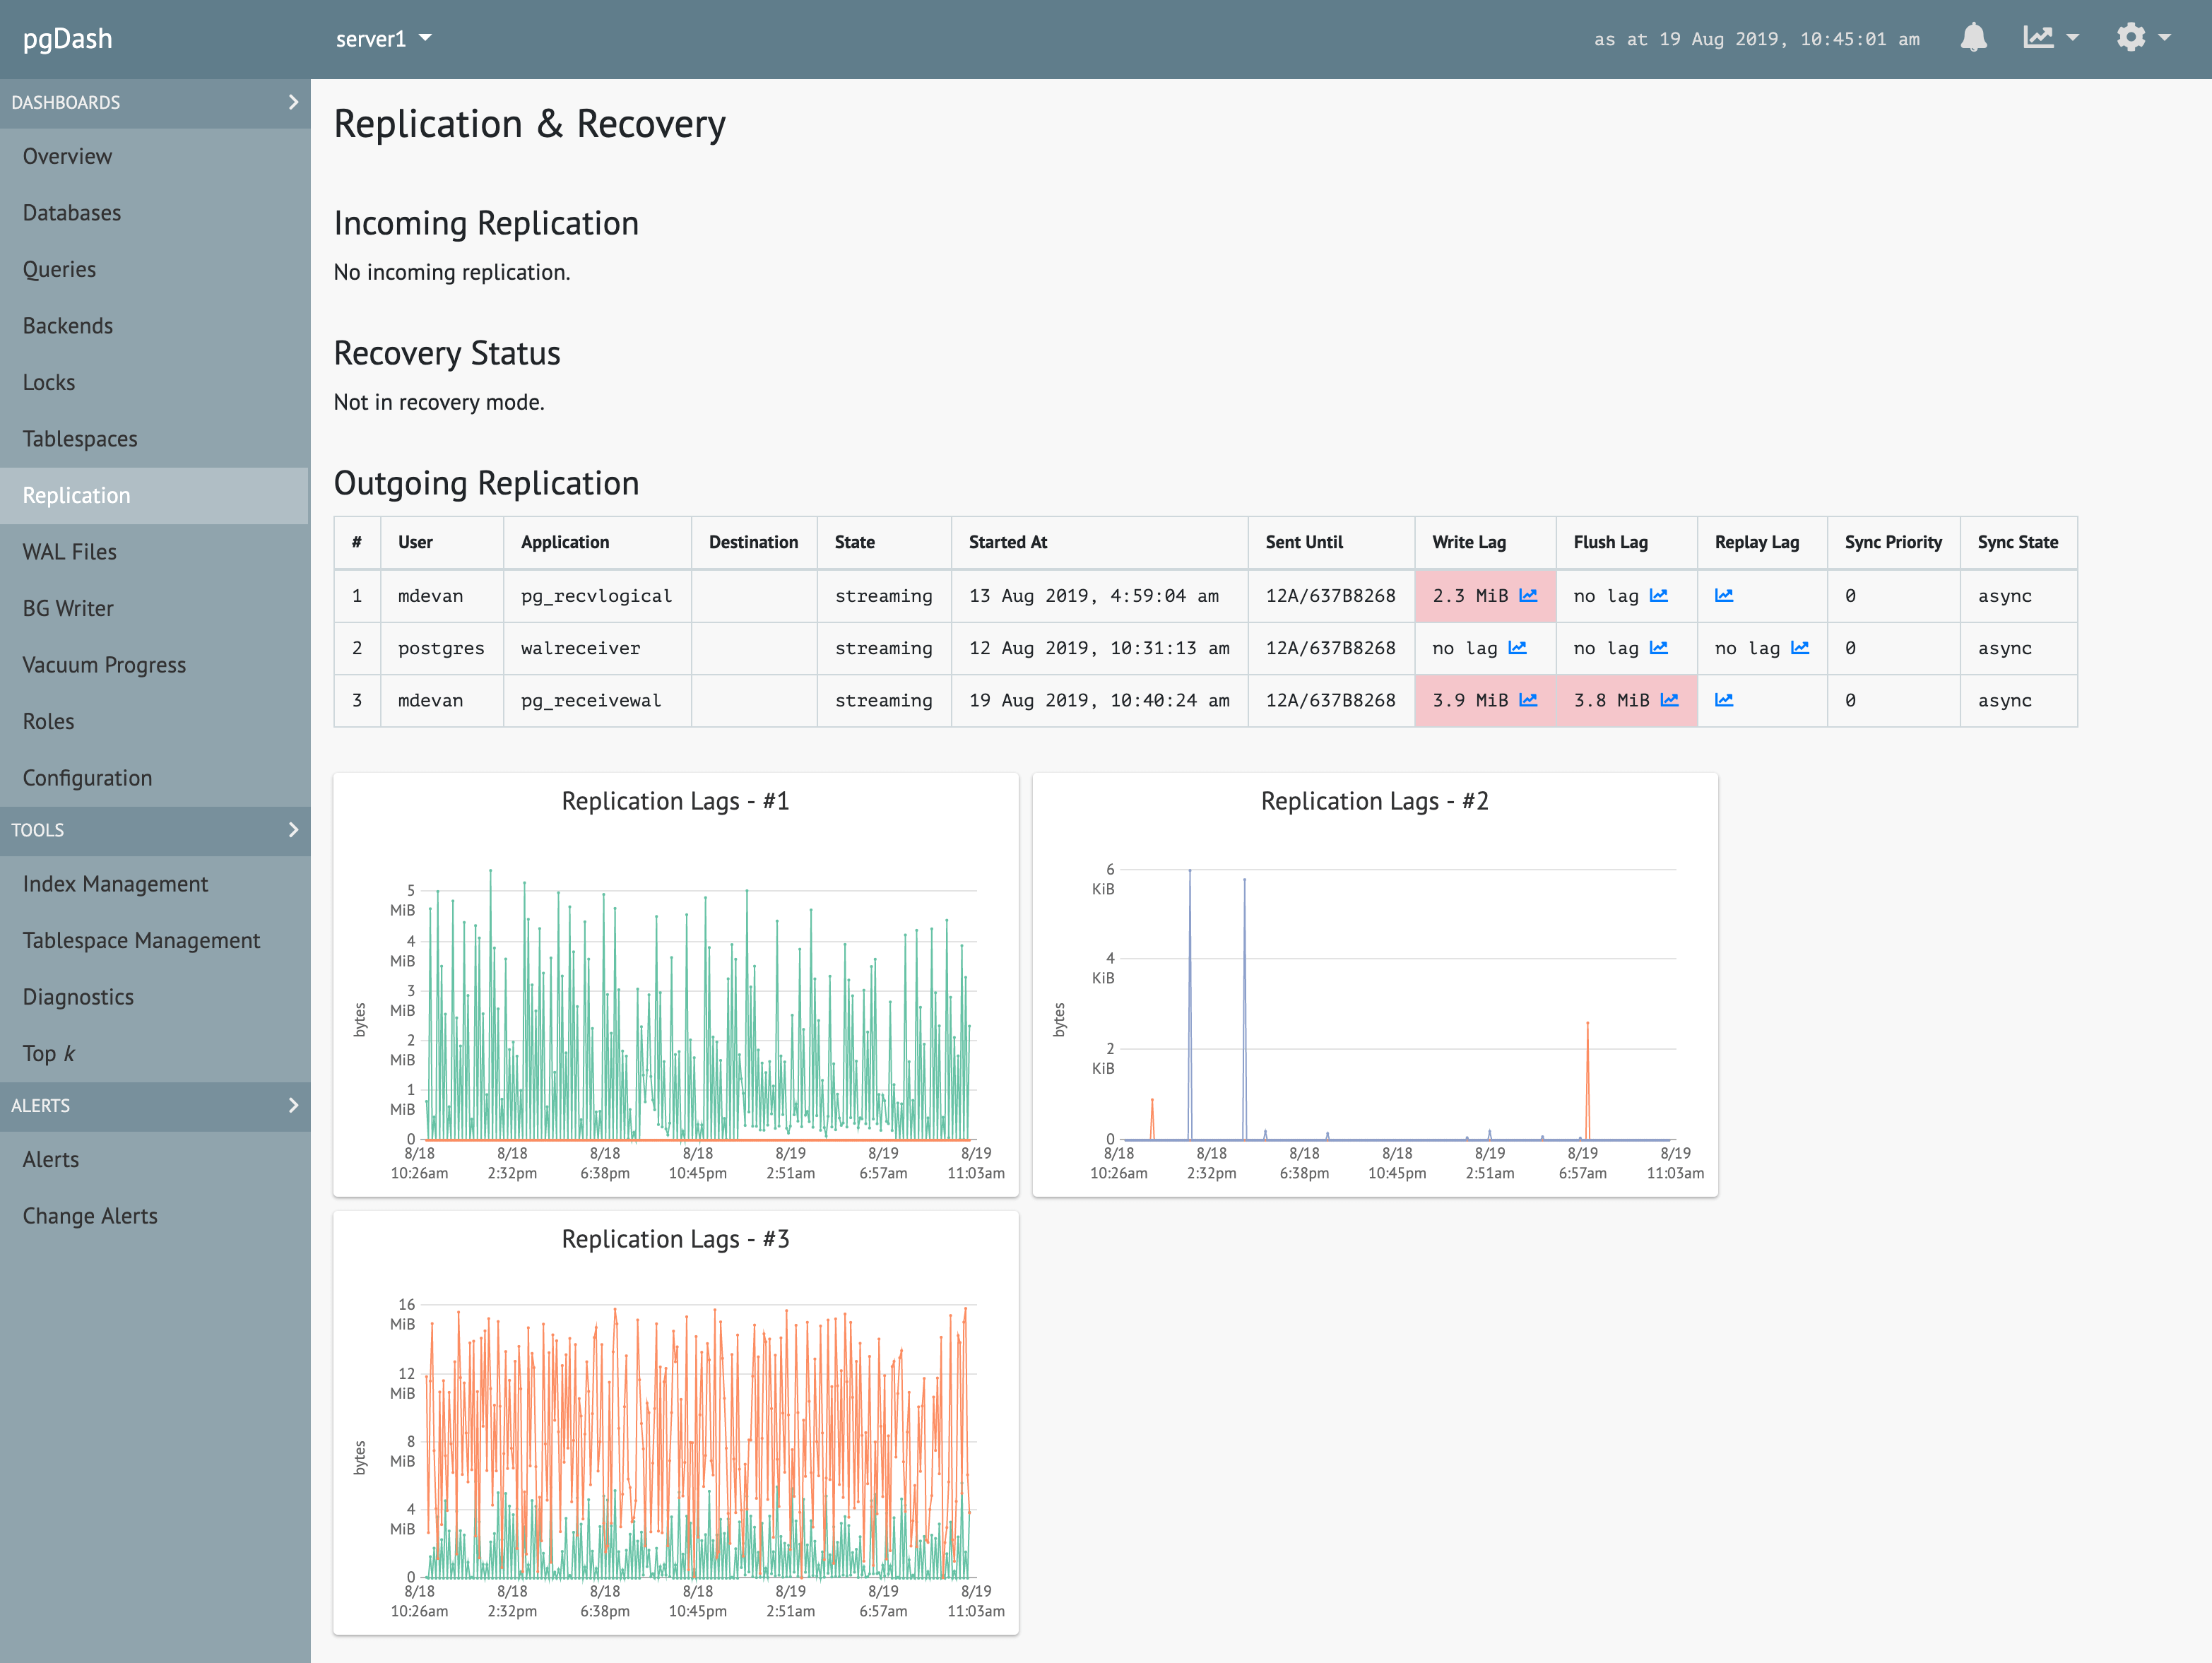
Replication: View replication lags and replication slot information at both outgoing and incoming ends.
Signup for a 14-Day pgDash Free Trial today to get in-depth insights into your PostgreSQL deployment.