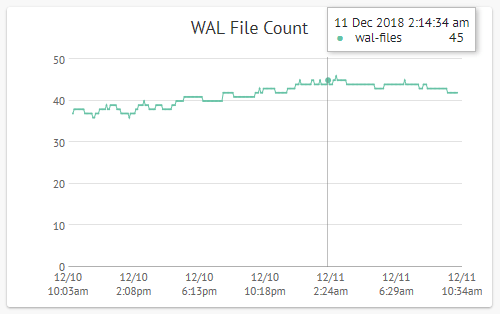
Keeping an eye on a simple metric can lead to a more performant and stable PostgreSQL deployment. Read on to learn why monitoring WAL files is important, and how to go about it.
What Are WAL Files Anyway?
Changes that happen to the data managed by the PostgreSQL server are serialized into replayable deltas and written out as an ordered sequence of files called the “Write Ahead Log”, or WAL. This architecture facilitates popular features of Postgres like Point-In-Time-Recovery (PITR) and streaming replication (and therefore read replicas, hot standby, failover and high availability).
WAL files are stored in $PGDATA/pg_wal (pg_wal was renamed from pg_xlog in
Postgres v10). Typically these are 16 MB files with a 24-character filename made
of hex numbers (0-9, A-F).
New WAL files keep getting created in the course of operation of the server, and the old ones are effectively deleted (they’re actually renamed and reused, as this incurs slightly less disk I/O than deleting and creating).
Why Should I Monitor Them?
Unfortunately, it can be difficult to predict the number of WAL files needed (and therefore the disk space needed for them) for the normal operation of the server. Configuration settings related to checkpoint (timeout, completion targets), WAL files (min and max wal file sizes, compression) and archiving (timeout) will also influence the number of WAL files lying in pg_wal. On top of all this, features like WAL archiving and replication slots can cause the retention of WAL files.
The biggest risk of leaving WAL files unmonitored is that PostgreSQL can, and will happily, retain them indefinitely if need be. They will grow unchecked and can end up consuming all available disk space. And if the Postgres server dies due to lack of disk space, remember that it needs to do a checkpoint on restart which may require even more disk space.
It also does not help that the creation of WAL files cannot be prevented in any situtation, as it is needed for the ACID guarantees provided by Postgres transactions.
In short, it is well worth your while to setup something that will monitor the count of WAL files for each Postgres server. Ideally, the number of files at any given time should lie between an upper and lower limit, with predictable variations arising from maintenance tasks and batch workloads.
What Should I Look For?
Spikes in WAL file count are typically caused by VACUUM-like maintenance tasks that create large volume of changes, or temporary tables and objects in a short period of time. These should come slowly back down to normal levels. These typically result in a lot of disk I/O and CPU activity, causing application queries to run slower until things are back to normal.
Increases in the count that refuse to come back down have to be dealt with quickly. These can be because of:
- Archival failures: If the archive script fails for a certain WAL file, Postgres will retain it and keep retrying until it succeeds. In the meantime, new WAL files will keep getting created. Ensure that your WAL archival processes are not broken, and can keep up with the WAL creation rate.
- Replication failures: When using streaming replication with replication slots, and a standby goes down, Postgres will retain the WAL files needed by the standby so that the stanby can resume from the point where it left off. If the standby goes offline for extended periods of time, or if someone forgot to delete the replication slot on the primary, the WAL files can be retained indefinitely. Ensure all your standbys and replication slots are active, and that your standbys can keep up the the changes happening at the primary.
- Long running transactions: These can prevent checkpoints, and therefore the WAL files have to be retained until the time checkpointer can make progress. Ensure that you have no long running transactions, especially ones that mutate a lot of data (read only transactions are OK).
How Do I Monitor WAL Files?
Scripts
Shell scripts that simply monitor the count of files in the pg_wal directory, and send the values to your existing monitoring systems should help you keep track of the WAL file count. Existing script-based tools like check_postgres can also collect this information. You should also have a way to correlate this count with the PostgreSQL activity going on at a specific time.
Queries
PostgreSQL does not have a built-in function or view that directly returns WAL file related information. You can however, use this query:
SELECT COUNT(*) FROM pg_ls_dir('pg_xlog') WHERE pg_ls_dir ~ '^[0-9A-F]{24}';that does the job of getting the count of WAL files. Note that you’ll need
superuser privileges or explicit GRANTs to do a pg_ls_dir.
If you have a system that can monitor the values returned by SQL queries, then this can fit into it.
pgmetrics
pgmetrics is an open source tool that can collect and report a lot of PostgreSQL metrics, including WAL file counts. Here is a snippet of it’s output:
WAL Files:
    WAL Archiving?       yes
    WAL Files:           18
    Ready Files:         0
    Archive Rate:        0.00 per min
    Last Archived:       7 Aug 2018 2:14:31 AM (46 seconds ago)
    Last Failure:
    Totals:              11 succeeded, 0 failed
    Totals Since:        2 May 2018 4:30:41 AM (3 months ago)
    +--------------------+---------------+
    |            Setting |         Value |
    +--------------------+---------------+
    |          wal_level |       logical |
    |    archive_timeout |           120 |
    |    wal_compression |            on |
    |       max_wal_size | 1024 (16 GiB) |
    |       min_wal_size | 100 (1.6 GiB) |
    | checkpoint_timeout |            30 |
    |   full_page_writes |            on |
    |  wal_keep_segments |             2 |
    +--------------------+---------------+
pgDash
pgDash is a modern, in-depth monitoring solution designed specifically for PostgreSQL deployments. pgDash shows you information and metrics about every aspect of your PostgreSQL database server, collected using the open-source tool pgmetrics.
With pgDash you can correlate WAL file activity at any given time with the SQL queries that were running at the time, and system-level metrics like CPU and memory usage.
Check out the features page to see all that pgDash can do.
