PostgreSQL comes with a plethora of configuration options, but changing the default settings of some of these options drastically improves the observability of your PostgreSQL server. You’ll want to set and configure these options before issues crop up in production, as they can provide information essential to understanding and resolving those issues.
Read on to learn more about the settings and extensions that expose metrics and information about the inner workings of your PostgreSQL server.
Log Line Prefix
The log_line_prefix configuration option determines what PostgreSQL writes at the beginning of each log line. The default depends on the specific Linux distribution or managed solution that you’re using, but more often than not it does not include a few items that can prove very useful in tracking down misbehaving clients. Try this log_line_prefix:
log_line_prefix = '%m [%p] %a %u %d %h 'It includes the timestamp (%m), the PID of the backend process (%p), the application name (%a) of the client, the username which the client has connected with (%u), the database which the client has connected to (%d) and the hostname or IP where the connection is coming from (%h). This results in log lines like this:
2021-01-30 05:06:03.675 UTC [73] psql postgres bench 172.17.0.1 ERROR:  relation "pgbench_akkounts" does not exist at character 15
2021-01-30 05:06:03.675 UTC [73] psql postgres bench 172.17.0.1 STATEMENT:  select * from pgbench_akkounts;
which are much more useful than the default. You can see that a client connected from 172.17.0.1 as user postgres to database bench, and the application was psql. Definitely an improvement over the default option, which shows only this:
2021-01-30 05:13:22.630 UTC [63] ERROR:  relation "pgbench_akkounts" does not exist at character 15
2021-01-30 05:13:22.630 UTC [63] STATEMENT:  select * from pgbench_akkounts;
Logging Slow Queries
PostgreSQL can be configured to log queries that take more than a set amount of time to execute. These go into the same log file; there is no separate slow query log file as in MySQL.
To log statements that take more than 1 second to execute, use the log_min_duration_statement option like this:
log_min_duration_statement = 1sNote that log_min_duration_statement will consider all statements (including for example, long-running admin statements like REINDEX TABLE) and not just queries (SELECT). Here are some log entries produced by this option:
2021-01-30 08:42:57.473 UTC [62] psql postgres postgres 172.17.0.1 LOG:  duration: 1016.283 ms  statement: select pg_sleep(1);
2021-01-30 08:52:00.541 UTC [62] psql postgres postgres 172.17.0.1 LOG:  duration: 1118.277 ms  statement: select pg_sleep(1.1);
If this results in too many logs of similar statements, you can tell Postgres to log only a percentage of it, using:
log_min_duration_statement = -1
log_min_duration_sample = 1s
log_statement_sample_rate = 0.25
This logs only 25% of the statements that become eligible for logging (the ones that took more than 1 second to execute). The log output is the same as before. There is no way to know how many eligible statements were not logged.
To log all statements, along with the time taken to execute them, use the log_statement option instead:
log_statement = mod
log_duration = on
The ‘mod’ option tells Postgres to log DDLs and data-modifying statements. This results in logs like these:
2021-01-30 08:35:08.985 UTC [64] pgbench postgres bench 172.17.0.1 LOG:  statement: insert into pgbench_tellers(tid,bid,tbalance) values (10,1,0)
2021-01-30 08:35:08.985 UTC [64] pgbench postgres bench 172.17.0.1 LOG:  duration: 0.241 ms
Be warned that it is not possible to sample statement logging enabled this way, all statements will be logged, and you’ll end up with tons of log entries.
Logging Locks and Deadlocks
Queries can wait too long to acquire a lock. Typically, an upper limit on how long to wait is set using the option lock_timeout, usually at the client side. If a query has been waiting this long to acquire a lock, Postgres will cancel the execution of this query and log an error:
2021-01-30 09:35:52.415 UTC [67] psql postgres testdb 172.17.0.1 ERROR:  canceling statement due to lock timeout
2021-01-30 09:35:52.415 UTC [67] psql postgres testdb 172.17.0.1 STATEMENT:  cluster t;
Let’s say you want to set a lock timeout of 1 minute, but log queries that wait for locks for more than, say 30 seconds. You can do this using:
log_lock_waits = on
deadlock_timeout = 30s
This will create logs like this:
2021-01-30 09:49:22.331 UTC [70] psql postgres testdb 172.17.0.1 LOG:  process 70 still waiting for ShareLock on transaction 493 after 30009.004 ms
2021-01-30 09:49:22.331 UTC [70] psql postgres testdb 172.17.0.1 DETAIL:  Process holding the lock: 68. Wait queue: 70.
2021-01-30 09:49:22.331 UTC [70] psql postgres testdb 172.17.0.1 CONTEXT:  while locking tuple (0,3) in relation "t"
2021-01-30 09:49:22.331 UTC [70] psql postgres testdb 172.17.0.1 STATEMENT:  select * from t for update;
The use of deadlock_timeout is not a typo: it is the value that the lock wait logging mechanism uses. Ideally, there should have been something like log_min_duration_lock_wait, but unfortunately, that is not the case.
In case of actual deadlocks, Postgres will abort the deadlocked transactions after deadlock_timeout duration, and will log the offending statements. No explicit configuration is necessary.
2021-01-30 09:55:37.724 UTC [68] psql postgres testdb 172.17.0.1 LOG:  process 68 detected deadlock while waiting for ShareLock on transaction 496 after 30007.633 ms
2021-01-30 09:55:37.724 UTC [68] psql postgres testdb 172.17.0.1 DETAIL:  Process holding the lock: 70. Wait queue: .
2021-01-30 09:55:37.724 UTC [68] psql postgres testdb 172.17.0.1 CONTEXT:  while locking tuple (0,3) in relation "t"
2021-01-30 09:55:37.724 UTC [68] psql postgres testdb 172.17.0.1 STATEMENT:  select * from t where a=4 for update;
2021-01-30 09:55:37.725 UTC [68] psql postgres testdb 172.17.0.1 ERROR:  deadlock detected
2021-01-30 09:55:37.725 UTC [68] psql postgres testdb 172.17.0.1 DETAIL:  Process 68 waits for ShareLock on transaction 496; blocked by process 70.
        Process 70 waits for ShareLock on transaction 495; blocked by process 68.
        Process 68: select * from t where a=4 for update;
        Process 70: select * from t where a=0 for update;
2021-01-30 09:55:37.725 UTC [68] psql postgres testdb 172.17.0.1 HINT:  See server log for query details.
2021-01-30 09:55:37.725 UTC [68] psql postgres testdb 172.17.0.1 CONTEXT:  while locking tuple (0,3) in relation "t"
2021-01-30 09:55:37.725 UTC [68] psql postgres testdb 172.17.0.1 STATEMENT:  select * from t where a=4 for update;
Logging Autovacuums
The autovacuum process kicks in when Postgres determines the data in a table has changed sufficiently to warrant a vacuum and analyze. To keep an eye on this process, enable the logging of autovacuum runs:
log_autovacuum_min_duration = 250msHere is a sample entry that was caused by excessive changes to one table:
2021-01-30 10:23:33.201 UTC [63]     LOG:  automatic vacuum of table "postgres.public.t": index scans: 0
        pages: 0 removed, 95 remain, 0 skipped due to pins, 0 skipped frozen
        tuples: 8991 removed, 10000 remain, 0 are dead but not yet removable, oldest xmin: 492
        buffer usage: 215 hits, 4 misses, 4 dirtied
        avg read rate: 1.885 MB/s, avg write rate: 1.885 MB/s
        system usage: CPU: user: 0.01 s, system: 0.00 s, elapsed: 0.01 s
        WAL usage: 244 records, 1 full page images, 67984 bytes
2021-01-30 10:23:33.222 UTC [63]     LOG:  automatic analyze of table "postgres.public.t" system usage: CPU: user: 0.01 s, system: 0.00 s, elapsed: 0.01 s
Note that autovacuum will typically trigger an analyze after the vacuum, and this will also be logged.
These logs will help you figure out how best to tune the autovacuum parameters, and will help in investigating if and when autovacuum is not being as effective as you thought it would be.
Logging Checkpoints
Checkpointing is the process of pushing WAL-logged changes into the actual files that back tables. Ideally checkpoints should occur at regular-and-not-too-frequent intervals, as it is a CPU and disk intensive process. For various reasons, checkpoints are also forced to happen before the next scheduled time, and this results in reduced query performance.
To keep an eye on checkpoint frequency and efficiency, enable logging of checkpoints:
log_checkpoints = onThis tells PostgreSQL to log the following whenever a checkpoint occurs:
2021-01-30 10:05:57.085 UTC [56]     LOG:  checkpoint starting: immediate force wait
2021-01-30 10:05:57.159 UTC [56]     LOG:  checkpoint complete: wrote 0 buffers (0.0%); 0 WAL file(s) added, 0 removed, 0 recycled; write=0.000 s, sync=0.000 s, total=0.074 s; sync files=0, longest=0.000 s, average=0.000 s; distance=0 kB, estimate=0 kB
The first line contains the flags that backend passed to the checkpointer. You can see that the “force” caused a checkpoint even though there were no pending changes to checkpoint. If “immediate” had not been specified, the checkpointer would have checkpointed up to checkpoint_completion_target.
Other Server-Side Settings
There are a couple of other settings that you can turn on in your PostgreSQL configuration that will help with diagnosing issues:
- track_io_timing - setting this to on lets you see the time spent in disk I/O for each query (combined with pg_stat_statements extension described below). See the docs about a caveat to turning this on, but should be safe on nearly any modern Linux. Seeing a query’s disk I/O cost is impossible without turning this on.
- track_commit_timestamp - setting this to on can be useful in debugging replication lags and other replication-related issues.
Query Statistics via pg_stat_statements
The extension pg_stat_statements is an essential accessory for any PostgreSQL deployment. It collects and records statistics for each query executed, and presents them as a view called “pg_stat_statements”. This is an extension, which means you have to install it explicitly in each database that you want data for, using the command:
CREATE EXTENSION pg_stat_statements;Since the extension relies on a .so, you’ll need to load that using shared_preload_libraries:
shared_preload_libraries = 'pg_stat_statements'This unfortunately requires a restart of the PostgreSQL server; so make sure you do this before going live.
If you have upgraded from a previous version of PostgreSQL, be sure to upgrade your pg_stat_statement extension also, using:
ALTER EXTENSION pg_stat_statements UPDATE;The pg_stat_statements extension does not log anything, it is used via querying the view of the same name. For more details, see the official documentation.
Query Execution Plans via auto_explain
auto_explain is another extension present in core PostgreSQL. It can log the execution plans of slow queries. It only needs to be added to shared_preload_libraries, and does not need to be installed as an extension. It also has a couple of other options that typically need to be set to non-default values:
shared_preload_libraries = 'pg_stat_statements,auto_explain'

auto_explain.log_min_duration = 1s
auto_explain.log_analyze = on
auto_explain.log_buffers = on
auto_explain.log_triggers = on
auto_explain.log_timing = on
auto_explain.log_verbose = on
auto_explain.log_format = json
The above logs the execution plan for any query that takes more than 1 second to complete. Here is a sample output:
2021-01-30 11:28:25.977 UTC [64] psql postgres postgres 172.17.0.1 LOG:  duration: 1.305 ms  plan:
        {
          "Query Text": "SELECT n.nspname as \"Schema\",\n  c.relname as \"Name\",\n  CASE c.relkind WHEN 'r' THEN 'table' WHEN 'v' THEN 'view' WHEN 'm' THEN 'materialized view' WHEN 'i' THEN 'index' WHEN 'S' TH
EN 'sequence' WHEN 's' THEN 'special' WHEN 'f' THEN 'foreign table' WHEN 'p' THEN 'table' WHEN 'I' THEN 'index' END as \"Type\",\n  pg_catalog.pg_get_userbyid(c.relowner) as \"Owner\"\nFROM pg_catalog.pg_class c
\n     LEFT JOIN pg_catalog.pg_namespace n ON n.oid = c.relnamespace\nWHERE c.relkind IN ('r','p','v','m','S','f','')\n      AND n.nspname <> 'pg_catalog'\n      AND n.nspname <> 'information_schema'\n      AND
n.nspname !~ '^pg_toast'\n  AND pg_catalog.pg_table_is_visible(c.oid)\nORDER BY 1,2;",
          "Plan": {
            "Node Type": "Sort",
            "Parallel Aware": false,
            "Startup Cost": 32.93,
            "Total Cost": 33.01,
            "Plan Rows": 32,
            "Plan Width": 224,
            "Actual Startup Time": 1.292,
            "Actual Total Time": 1.298,
            "Actual Rows": 0,
[... lots of text snipped ...]
To learn more about auto_explain, see the official docs.
The extensions pg_stat_statements and auto_explain are the only two widely-supported options that PostgreSQL has for query performance management and query plan management. It pays to get to know these two features, and to plan ahead on using them in production.
Application Name
The application name is a client-side parameter, and can usually be set in DSNs or libpq-style connection strings that your application uses for connection information. Many tools and utilities in the PostgreSQL eco system understand application name, and it helps to set this to a meaningful value, for example:
application_name = weekly-revenue-reportThis would be set for each client application that connects to your PostgreSQL server.
About pgDash
pgDash is a modern, in-depth monitoring solution designed specifically for PostgreSQL deployments. pgDash shows you information and metrics about every aspect of your PostgreSQL database server, collected using the open-source tool pgmetrics.
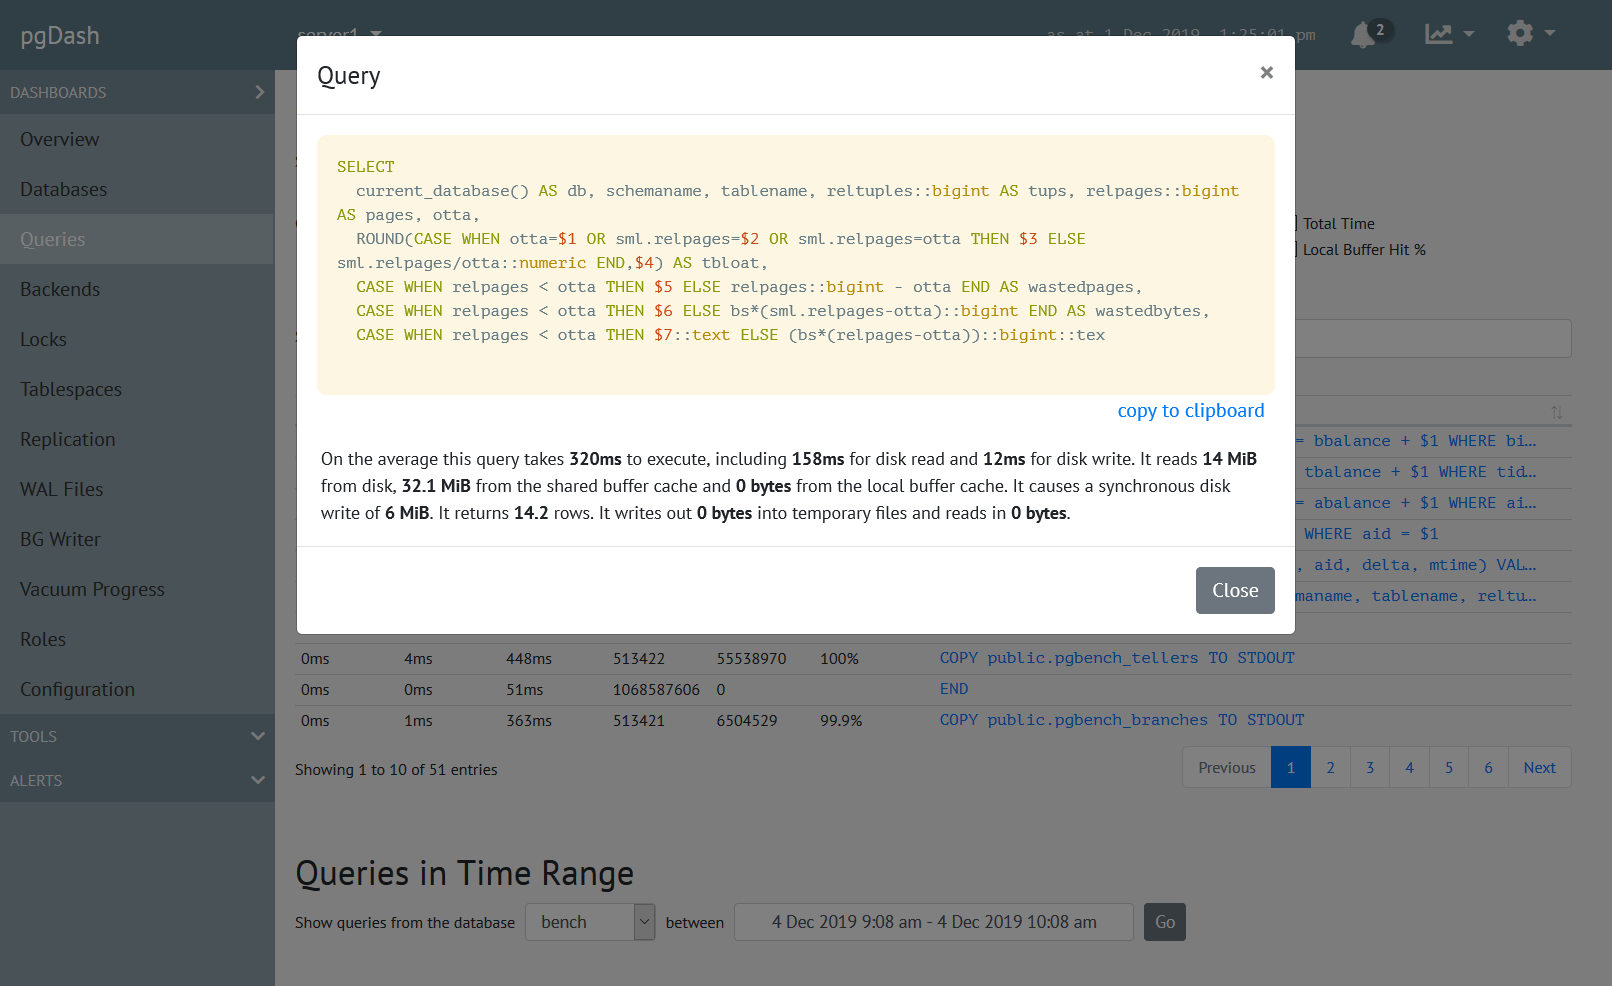
pgDash provides core reporting and visualization functionality, including collecting and displaying PostgreSQL information and providing time-series graphs, detailed reports, diagnostics, alerting, teams and more. Checkout the features here or signup today for a free trial.