Figuring out why a query that performs well in development and testing blows up in production can sometimes be a challenge. Read on to learn more about a few features that can provide insights into how your queries fare in production.
Currently Running Queries
When a client connects a PostgreSQL server, the main Postgres server process (historically called the postmaster) spawns a new process (called the backend) to service the client’s queries. Each backend, therefore, is either waiting for it’s client to send in a query, or trying to execute one.
The system view pg_stat_activity shows information about every backend that is currently running. In particular, it shows the query that the backend is currently executing if active, or the last query it executed if it is waiting for the client to send in another query.
Here are two backends serving clients connected to the database testdb, with
both of them actively executing their queries:
testdb=# select usename,datname,state,query from pg_stat_activity where datname='testdb';
-[ RECORD 1 ]-----------------------------------------------------------------------------
usename | postgres
datname | testdb
state   | active
query   | SELECT pg_sleep(10);
-[ RECORD 2 ]-----------------------------------------------------------------------------
usename | postgres
datname | testdb
state   | active
query   | select usename,datname,state,query from pg_stat_activity where datname='testdb';
Sometimes the query might be waiting for a lock, and this too shows up in pg_stat_activity. You can see an INSERT waiting for a relation lock here:
testdb=# select wait_event_type, wait_event, left(query, 60) from pg_stat_activity where datname='testdb';
-[ RECORD 1 ]---+-------------------------------------------------------------
wait_event_type | Client
wait_event      | ClientRead
left            | lock table t in access exclusive mode;
-[ RECORD 2 ]---+-------------------------------------------------------------
wait_event_type |
wait_event      |
left            | select wait_event_type, wait_event, left(query, 60) from pg_
-[ RECORD 3 ]---+-------------------------------------------------------------
wait_event_type | Lock
wait_event      | relation
left            | insert into t values (1);
For more information on pg_stat_activity, see the docs.
While this view is helpful to understand what Postgres is doing currently, it does not provide information about query execution statistics, or information about queries that have finished execution.
All Queries Run In The Past
For that, the extension pg_stat_statements is invaluable. This extension is included in the core PostgreSQL distribution and also available on managed services like AWS RDS and GCP SQL.
pg_stat_statements (PSS) is an “extension” in PostgreSQL terms, and needs to be installed first:
- Consult your Linux distro documentation to see if the extension is
pre-installed or if it requires the installation of another package. For
example, on Centos 7 you’ll need to
sudo yum install postgresql-contrib. - Edit the main configuration file postgresql.conf (typically under
/etc, like/etc/postgresql/10/main/postgresql.confon Debian) and change the value ofshared_preload_librariesto “pg_stat_statements”. This is a comma-separated list of values, so if there is something there already, append a comma and then “pg_stat_statements”. - For AWS RDS, you’ll need to modify your active parameter group and set the value.
- After editing “shared_preload_libraries”, you’ll need to restart the PostgreSQL daemon. Unfortunately there is no way around this. On AWS RDS, you’ll need to restart the RDS instance.
- After a restart, the PostgreSQL server would have loaded the shared library,
and we can install the extension by running
CREATE EXTENSION
pg_stat_statements
. You’ll need to be a superuser to run this command. - You can actually install the extension in any database, and yet see the queries across all databases.
Once the extension is installed, you can query the view called
pg_stat_statements to get information about every single query executed
since the extension was installed.
The numbers, like time taken to execute the query, are accumulated as a sum. For
the query execution time alone, some statistics (average, min, max, standard
deviation) are presented. These values can be cleared using the function
pg_stat_statements_reset.
Here is how a row from pg_stat_statements looks like:
testdb=# select * from pg_stat_statements where query like '%pg_sleep%' and dbid=42548;
-[ RECORD 1 ]-------+--------------------
userid              | 10
dbid                | 42548
queryid             | 2649515222348904837
query               | SELECT pg_sleep($1)
calls               | 1
total_time          | 10016.782625
min_time            | 10016.782625
max_time            | 10016.782625
mean_time           | 10016.782625
stddev_time         | 0
rows                | 1
shared_blks_hit     | 0
shared_blks_read    | 0
shared_blks_dirtied | 0
shared_blks_written | 0
local_blks_hit      | 0
local_blks_read     | 0
local_blks_dirtied  | 0
local_blks_written  | 0
temp_blks_read      | 0
temp_blks_written   | 0
blk_read_time       | 0
blk_write_time      | 0
Apart from the identifying parameters (user, database, query), you can figure out many interesting things about your query:
- How long it takes to execute typically (
mean_time) - How many rows it returns on the average (
rows/calls) - The amount of data read from the shared buffer cache, and the amount of data
read from the disk (the
shared_blks_readshows the total amount of data that the query read, of whichshared_blks_hitcame from the cache) - The amount of data that had to be written to the disk synchronously because
of cache pressure (
shared_blks_written) - The amount of data written, as the number of blocks touched
(
shared_blks_dirtied) - The amount of time spent in disk reads and writes (
blk_{read,write}_time) - Temporary files written to and read from (
temp_blks_{read,written}) - Temporary tables written to and read from (
local_*)
The disk read and write times are available only if the configuration parameter
track_io_timing is turned on. By default, it is not. On most modern Linux
systems it should be ok to turn this parameter on. Read
more.
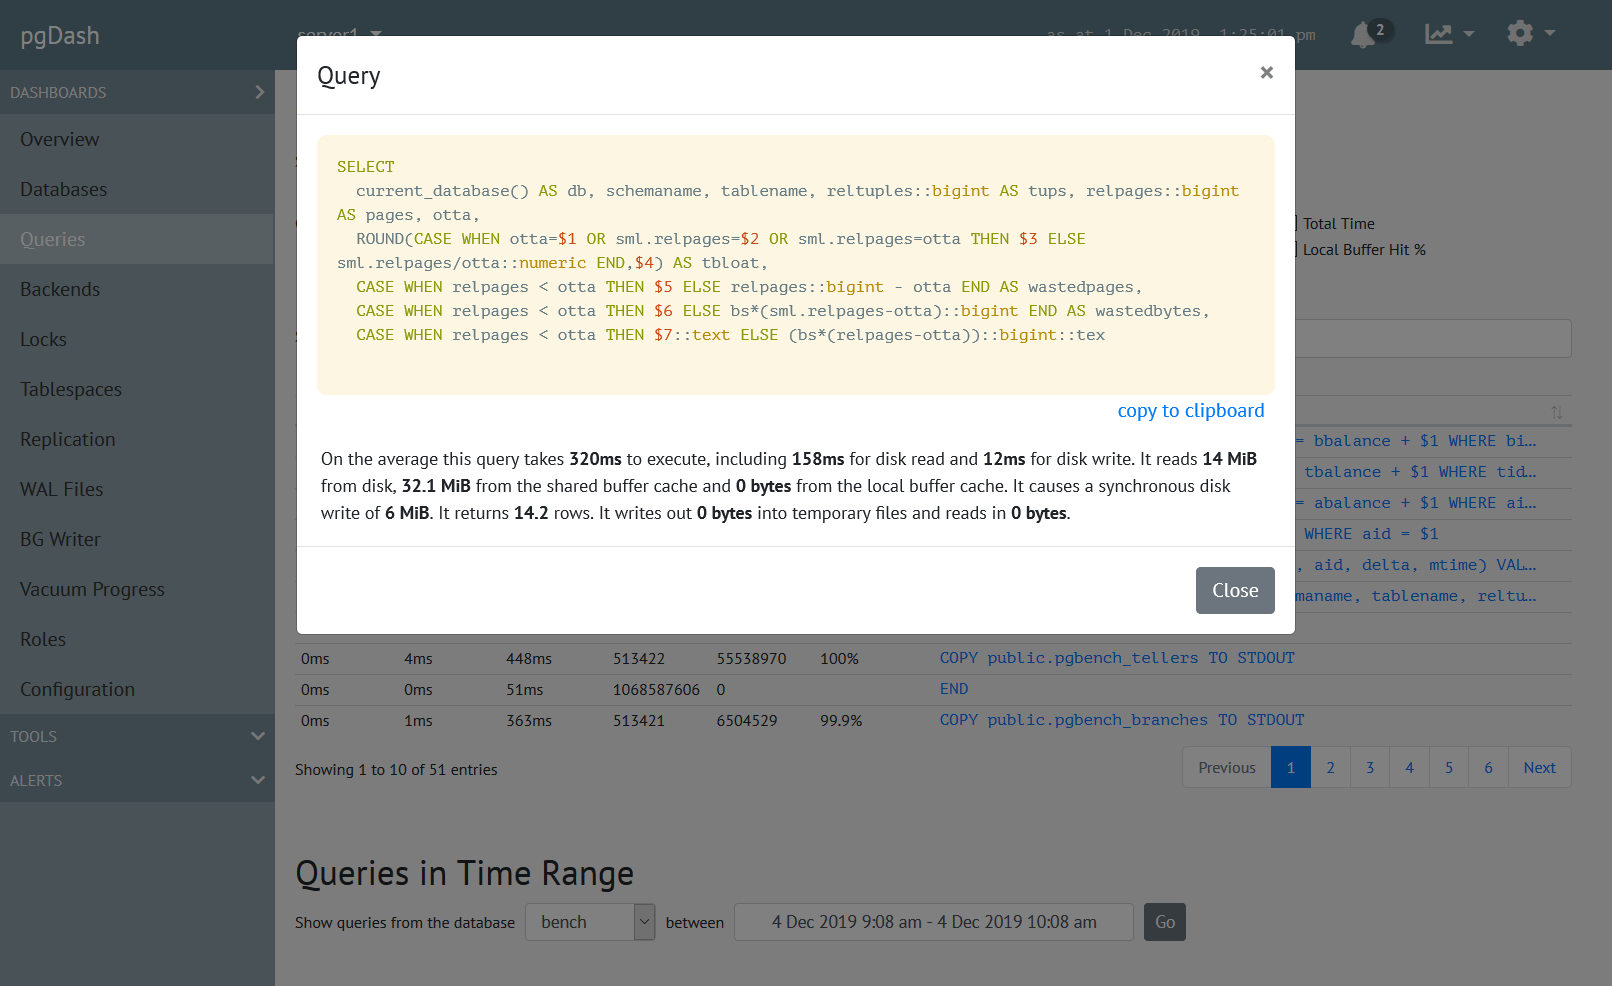
It is worthwhile to snapshot the pg_stat_statements data continuously at
regular intervals to see how these parameters are trending on a per-query basis.
The open source tool pgmetrics can extract and expose
the pg_stat_statements data as JSON for easier automation.
Queries Run During a Time Range
Once you have such a system in place it becomes easy to track the queries executed in a given time frame. This makes it easy to debug issues like why a nightly batch job took longer than expected.
By subtracting the counters between two given timestamps, you can find out most of the numbers as before, except for min, max and standard deviation. This is sufficient to identify the queries that were executed within the time range and the resources they consumed.
Logging Slow Queries
Another way to quickly identify queries that take more time than expected is to turn on the logging of statements. You can specify a threshold duration, and if the query takes longer than this to finish, it is logged. (In the regular PostgreSQL log file, there is no separate one for slow queries.)
To turn on this feature, edit the configuration as below:
log_min_duration_statement = 1000 # in millisecondsand reload Postgres. You can also use ALTER SYSTEM:
ALTER SYSTEM SET log_min_duration_statement = 1000; -- in millisecondsWith this, any statement (including non-DML ones) that takes more than a second to finish gets logged:
2019-12-02 16:57:05.727 UTC [8040] postgres@testdb LOG: duration: 10017.862 ms statement: SELECT pg_sleep(10);The actual time taken by the query, as well as the full SQL text, is logged.
If you have a log monitoring system and can track the number of slow queries per hour / per day, it can serve as a good indicator of application performance.
Query Execution Plans
Once you do have located a query which you feel should run faster, the next
step is to have a look at it’s query plan. Typically, you need the actual
query plan from production servers to work with. If you’re able to run
EXPLAIN on production servers that great, else you need to rely on
auto_explain.
auto_explain is another core PostgreSQL extension, either already installed or
available as a “contrib” package for your distro. It is also available on AWS
RDS. auto_explain is a bit simpler to install than pg_stat_statements:
- Edit the postgres configuration (or the RDS parameter group)
shared_preload_librariesto includeauto_explain. - You don’t have to restart Postgres though, you can instead just run:
LOAD 'auto_explain';. - You’ll want to configure it’s settings, at least this one:
auto_explain.log_min_duration = 1000 # seconds
Essentially, whenever a query takes longer than
auto_explain.log_min_duration number of seconds to complete, auto_explain
logs the query and it’s query execution plan in the log file, like this:
2019-12-04 09:23:05.130 UTC [12823] postgres@testdb LOG:  duration: 11025.765 ms  plan:
        Query Text: select pg_sleep(11);
        Result  (cost=0.00..0.01 rows=1 width=4) (actual time=11025.716..11025.718 rows=1 loops=1)
          Output: pg_sleep('11'::double precision)
It can log the plan in JSON format too, if you have scripts that can process it:
2019-12-02 17:30:53.676 UTC [8040] postgres@testdb LOG:  duration: 10000.230 ms  plan:
        {
          "Query Text": "SELECT pg_sleep(10);",
          "Plan": {
            "Node Type": "Result",
            "Parallel Aware": false,
            "Startup Cost": 0.00,
            "Total Cost": 0.01,
            "Plan Rows": 1,
            "Plan Width": 4,
            "Actual Startup Time": 10000.205,
            "Actual Total Time": 10000.206,
            "Actual Rows": 1,
            "Actual Loops": 1,
            "Output": ["pg_sleep('10'::double precision)"],
            "Shared Hit Blocks": 0,
            "Shared Read Blocks": 0,
            "Shared Dirtied Blocks": 0,
            "Shared Written Blocks": 0,
            "Local Hit Blocks": 0,
            "Local Read Blocks": 0,
            "Local Dirtied Blocks": 0,
            "Local Written Blocks": 0,
            "Temp Read Blocks": 0,
            "Temp Written Blocks": 0,
            "I/O Read Time": 0.000,
            "I/O Write Time": 0.000
          },
          "Triggers": [
          ]
        }
In Postgres, there is no way other than auto_explain to look at the execution plan of a query that has already executed, which makes auto_explain an important tool in your toolbox.
About pgDash
pgDash is a modern, in-depth monitoring solution designed specifically for PostgreSQL deployments. pgDash shows you information and metrics about every aspect of your PostgreSQL database server, collected using the open-source tool pgmetrics.
pgDash provides core reporting and visualization functionality, including collecting and displaying PostgreSQL information and providing time-series graphs, detailed reports, diagnostics, alerting, teams and more. Checkout the features here or signup today for a free trial.