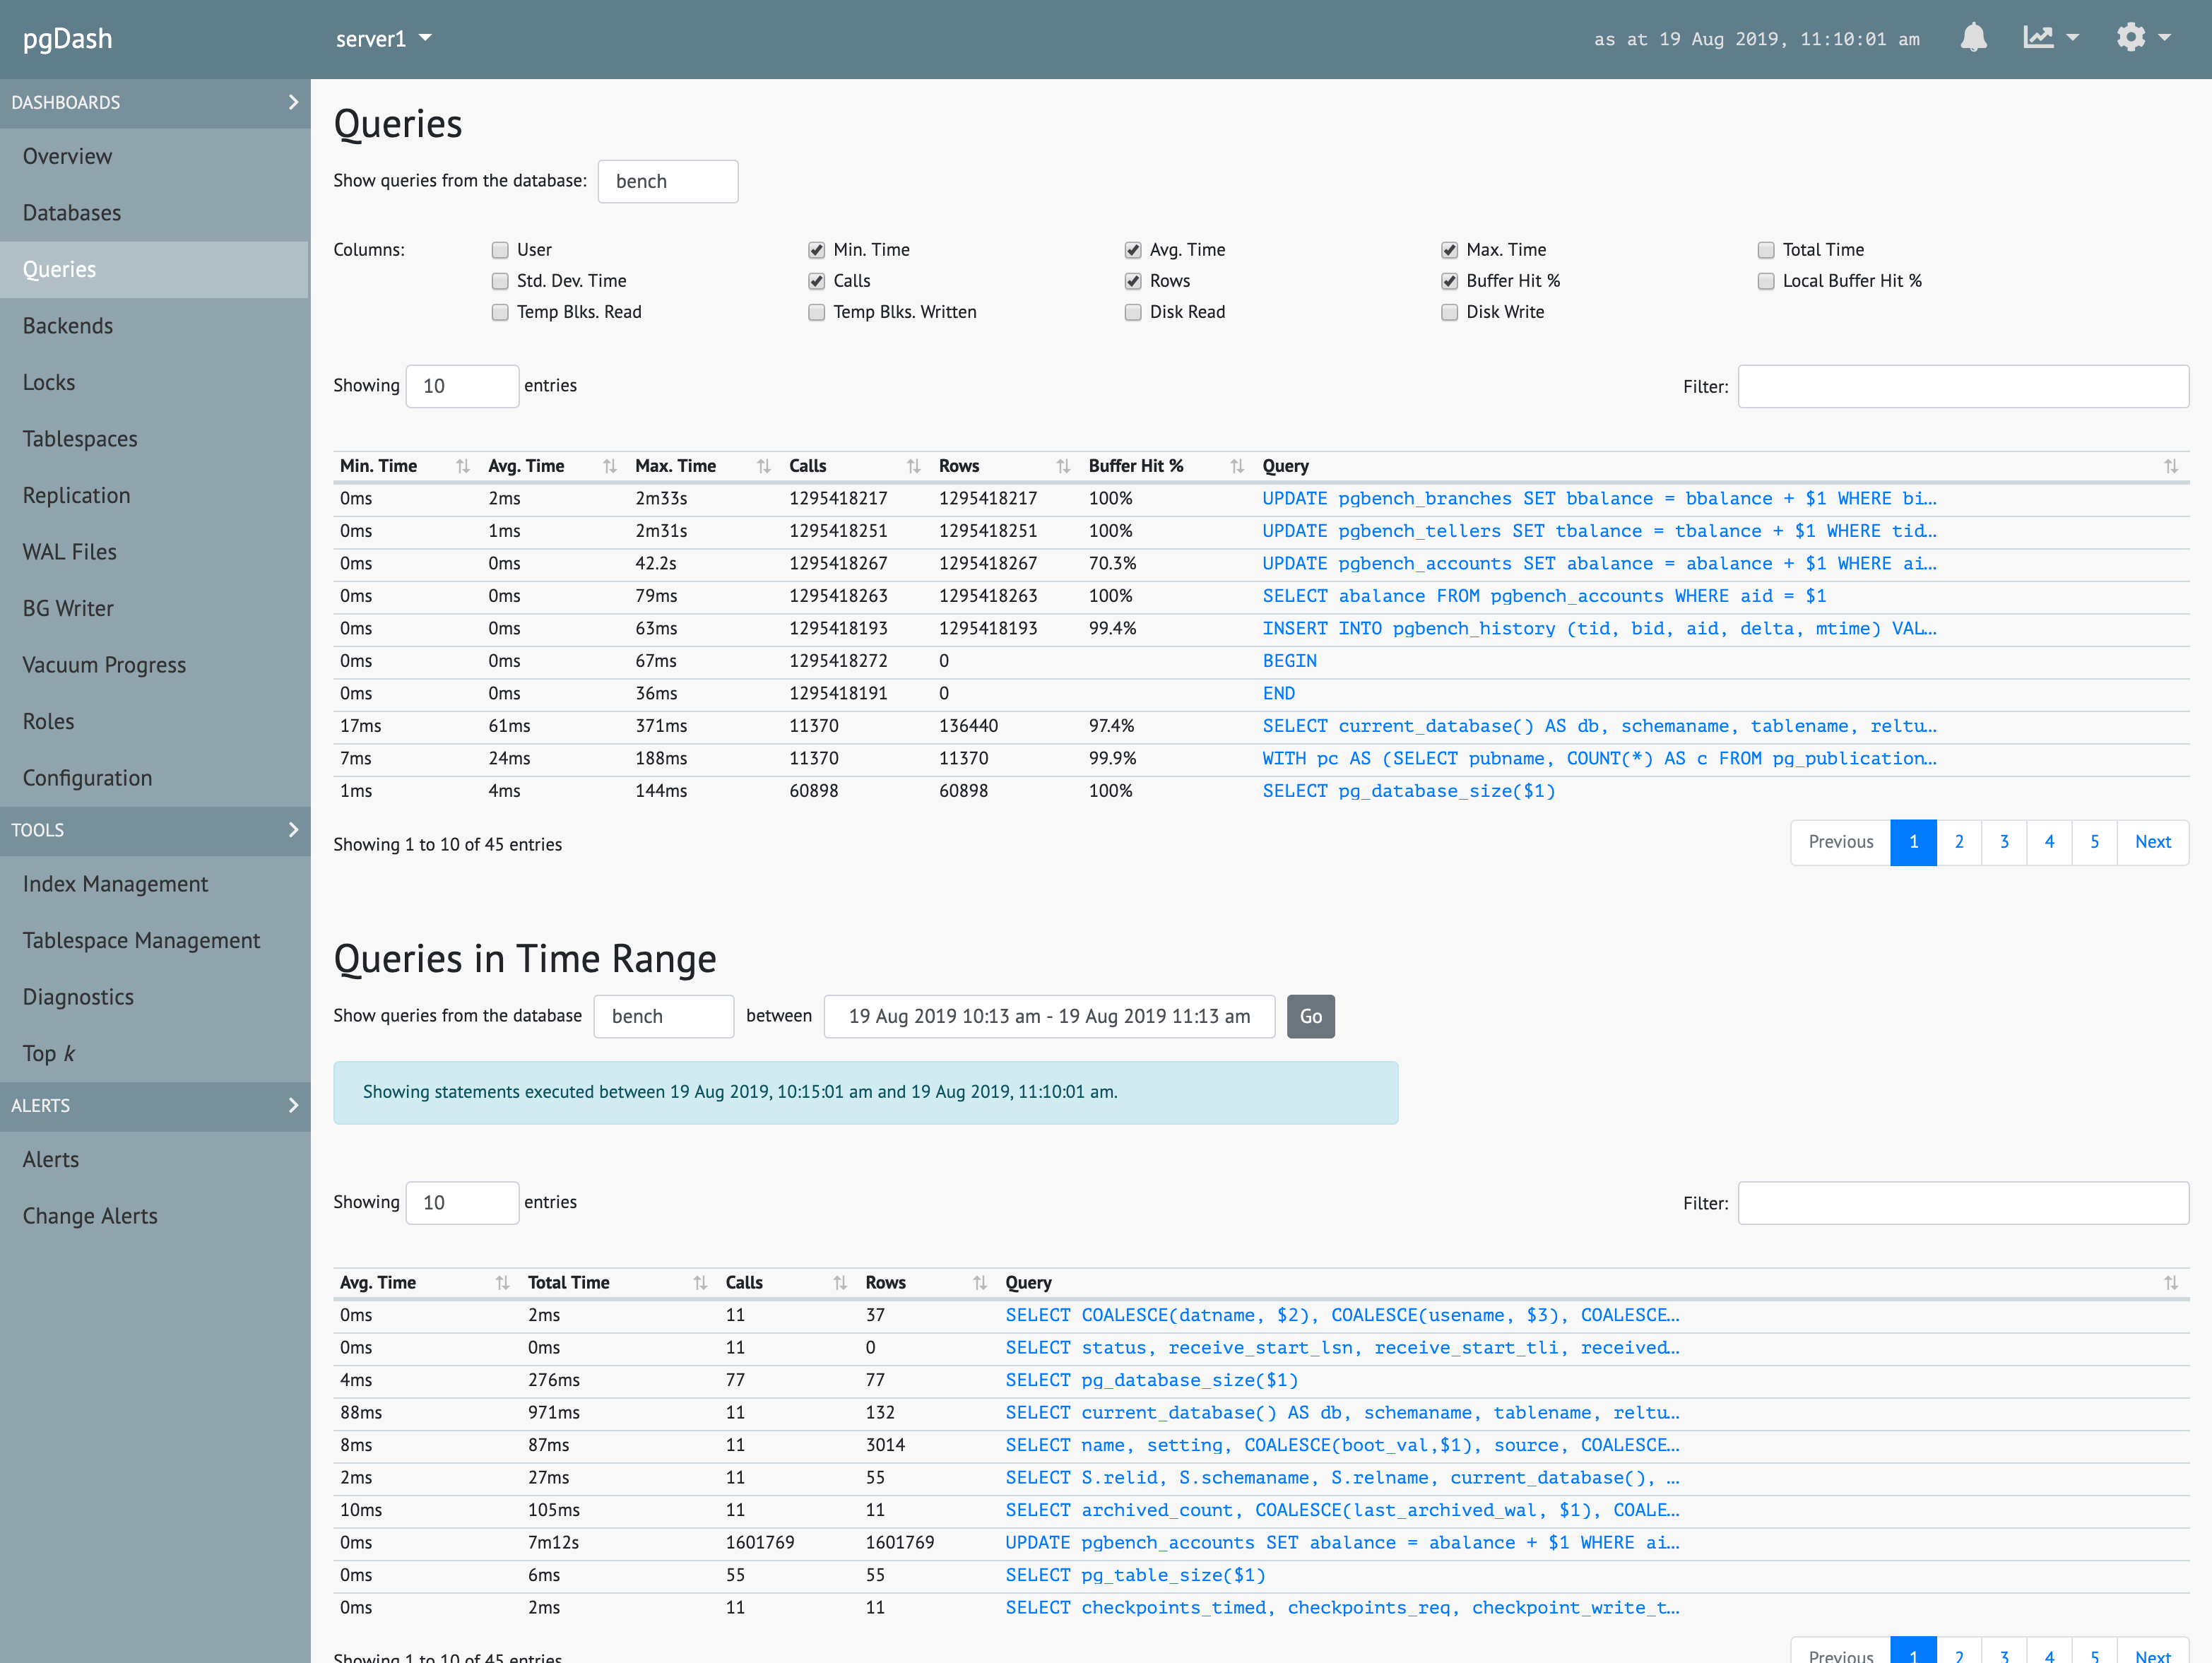
In-Depth PostgreSQL Monitoring

pgDash is a comprehensive diagnostic and monitoring solution designed to help you ensure the ongoing health and performance of your PostgreSQL deployment.

pgDash provides core reporting and visualization functionality, including collecting and displaying PostgreSQL information and providing diagnostics, time-series graphs, detailed reports, alerting, teams and more. SaaS and self-hosted/on-premise options available. Works with AWS RDS and Aurora.
Start Free

“pgDash saves us a lot of time by providing us with a single dashboard for dealing with performance, capacity planning, and resourcing issues. The time savings we experience make the subscription cost easily justifiable.”

— Erwin Fritz, Manager, IS Operations, GLJ LTD


How It Works

1
Collect PostgreSQL data, in JSON format, using our open-source tool pgmetrics.
2
Send it to pgDash regularly, using the pgdash command-line tool.
$ pgmetrics -f json -h myserver db1 db2
$ pgmetrics -f json -h myserver db1 db2 |
    pgdash -a myapikey report myserver

Features

Queries

pgDash Queries

Extensive information about each SQL query executed, including time series graphs, execution plans with visualization, and suggestions to improve query performance.
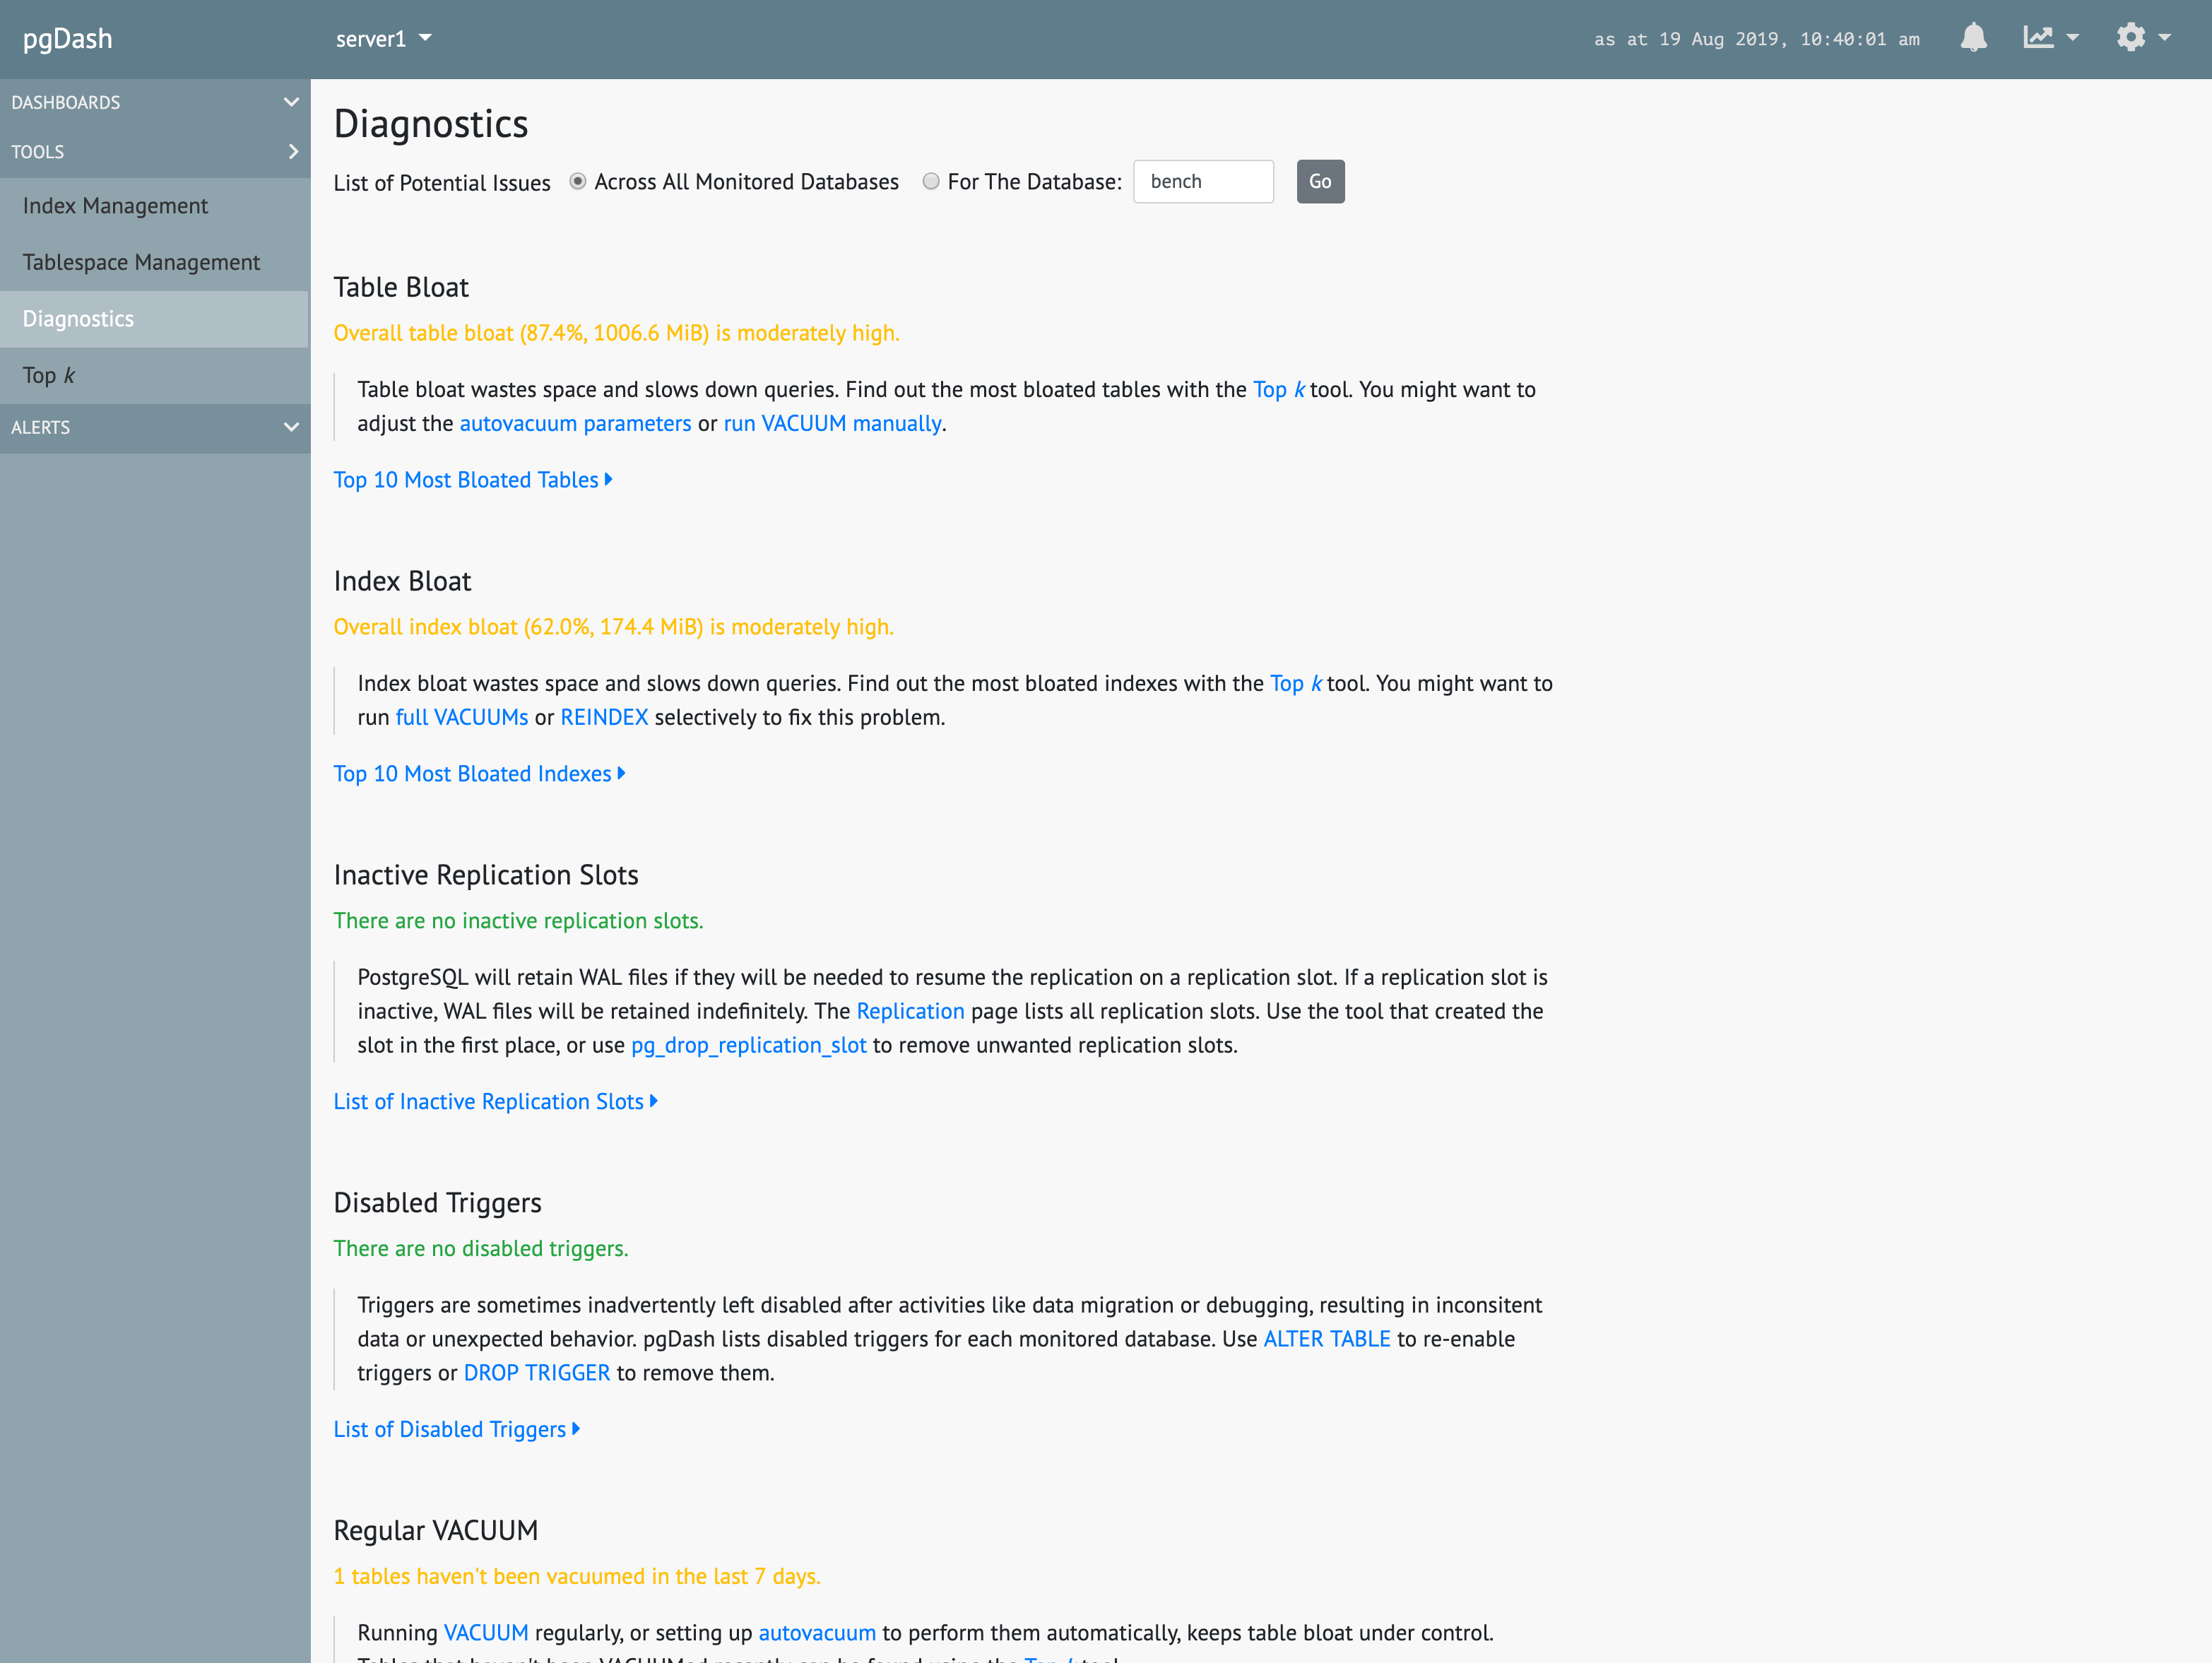
Diagnostics

pgDash Diagnostics

Diagnostics examines your PostgreSQL server and databases scanning for potential issues that can impact the health and performance of the deployment.
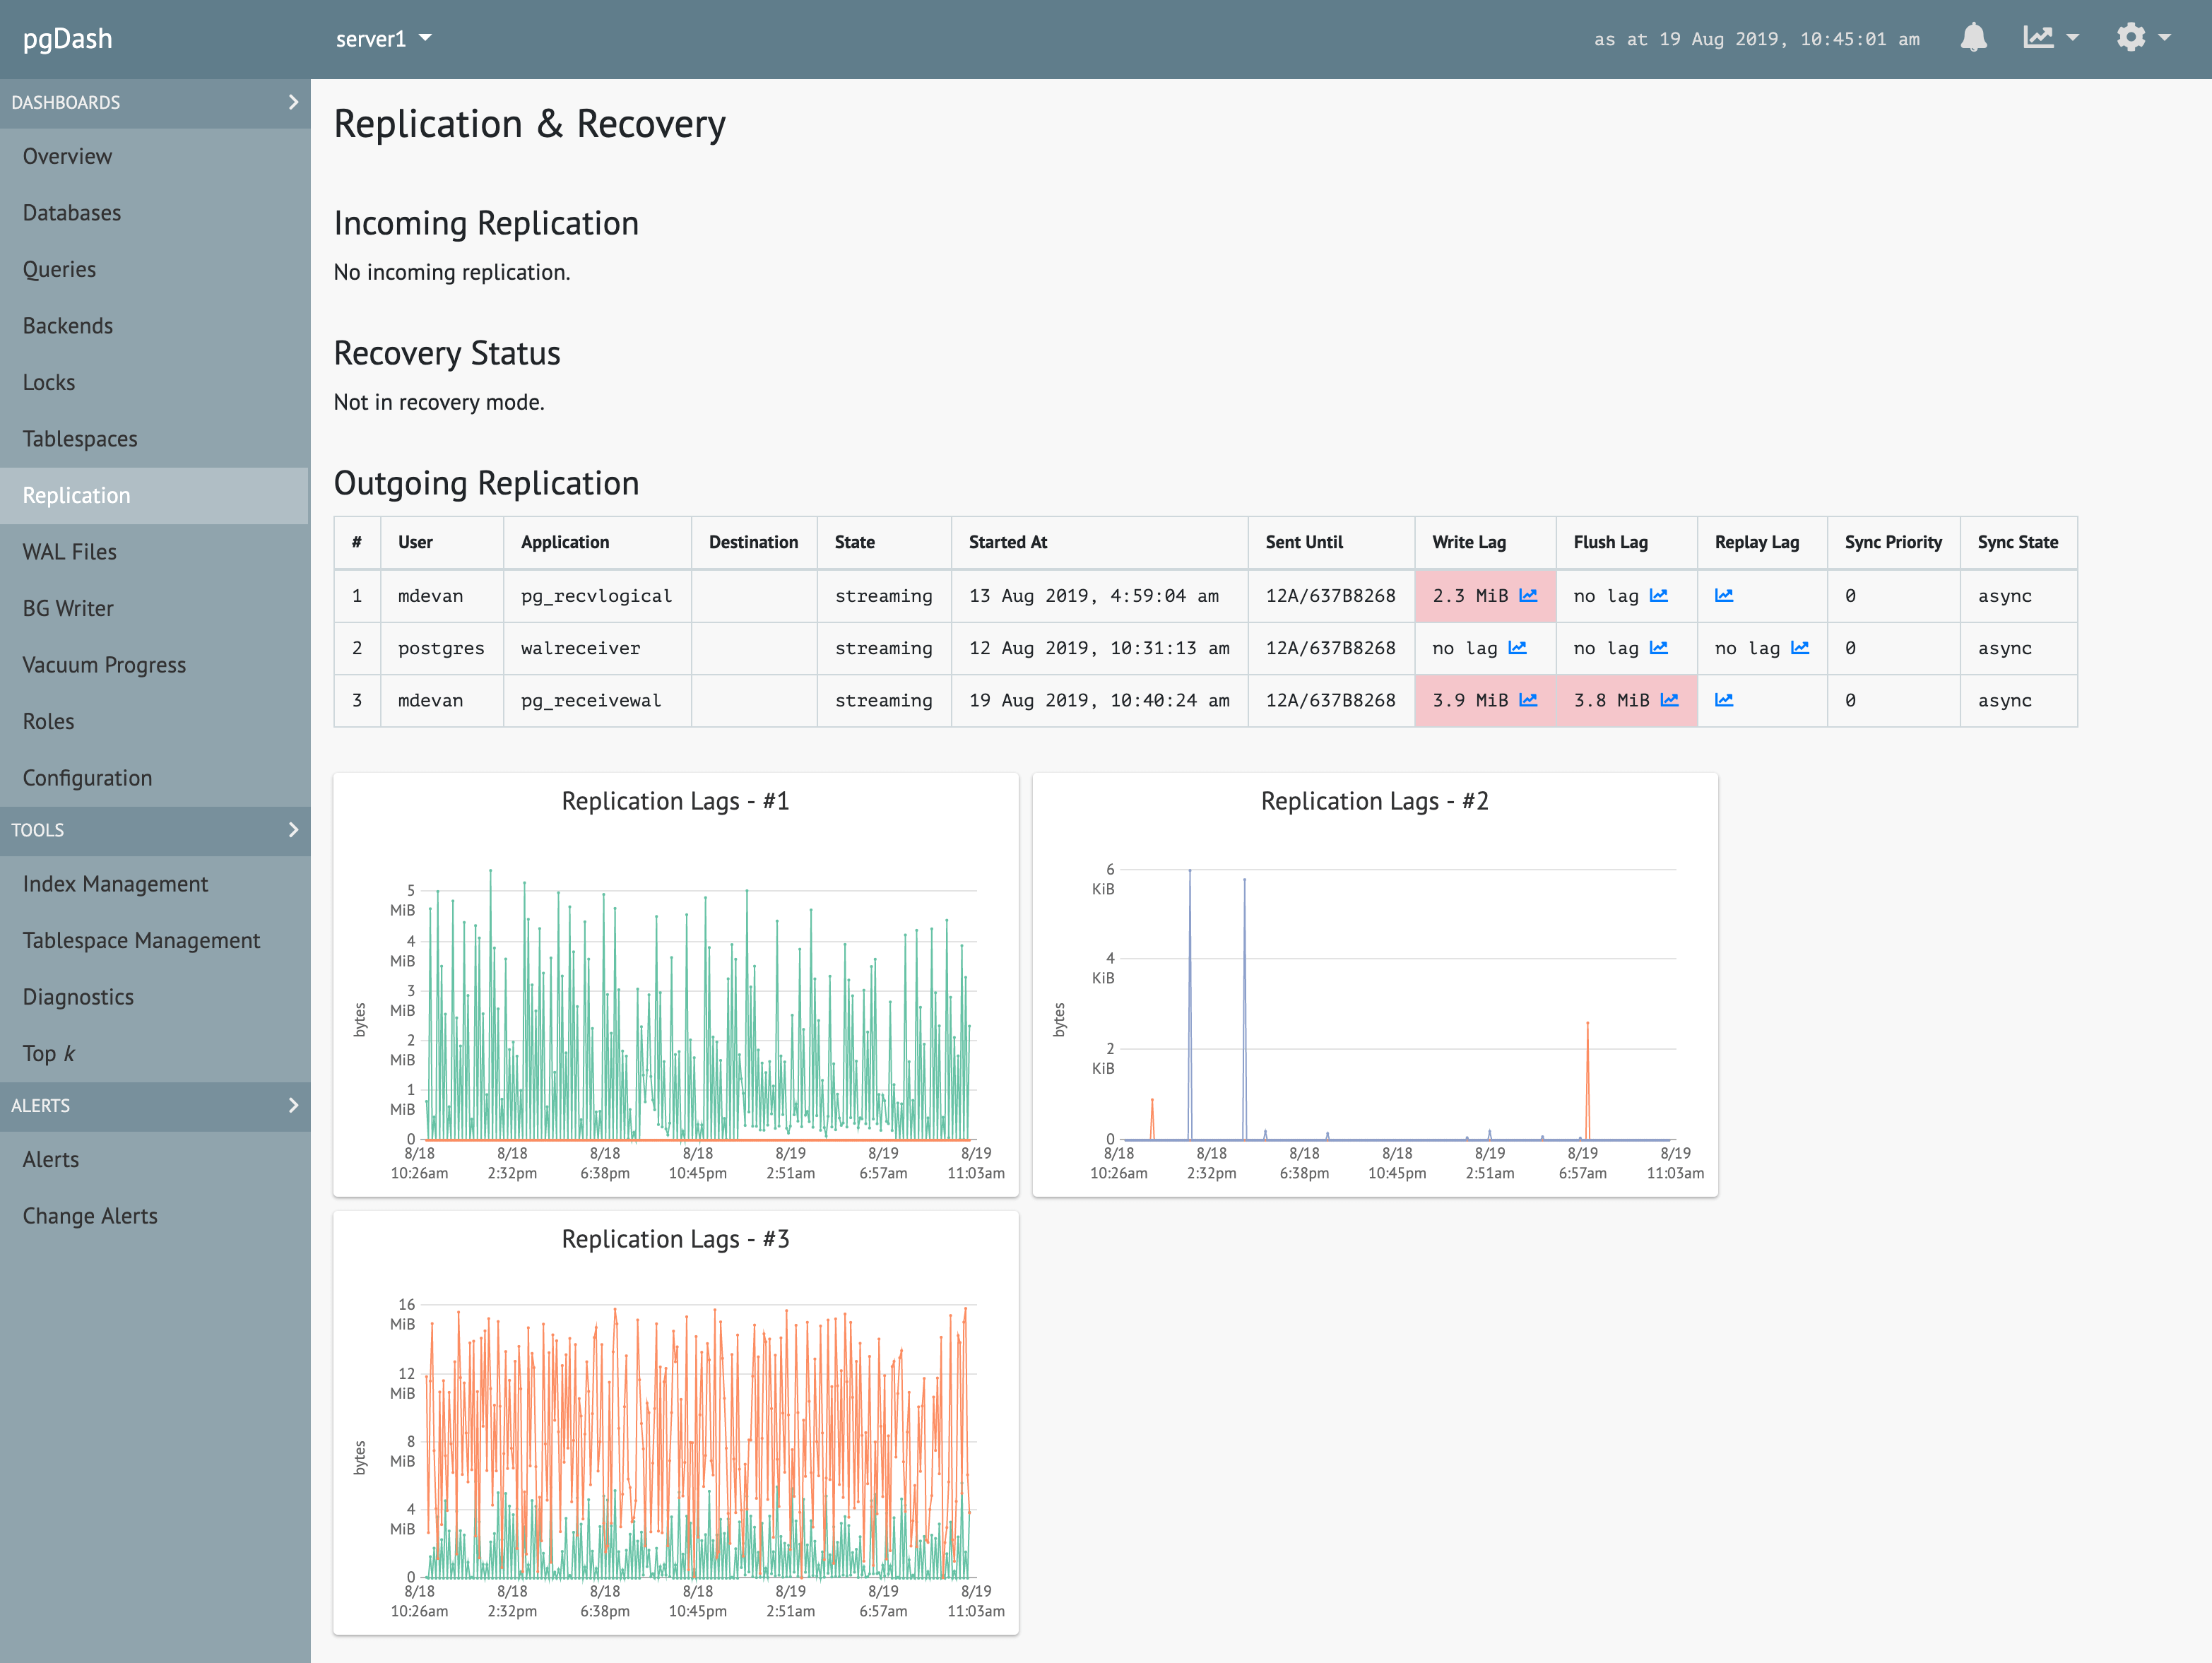
Replication

pgDash Replication

Monitor extensive replication metrics, including lags at primary and standby servers, physical and logical replication slot information, and standby recovery progress.

Tables & Indexes

pgDash Tables and Indexes

Locks & Backends

pgDash Backends

Inspector

pgDash Inspector

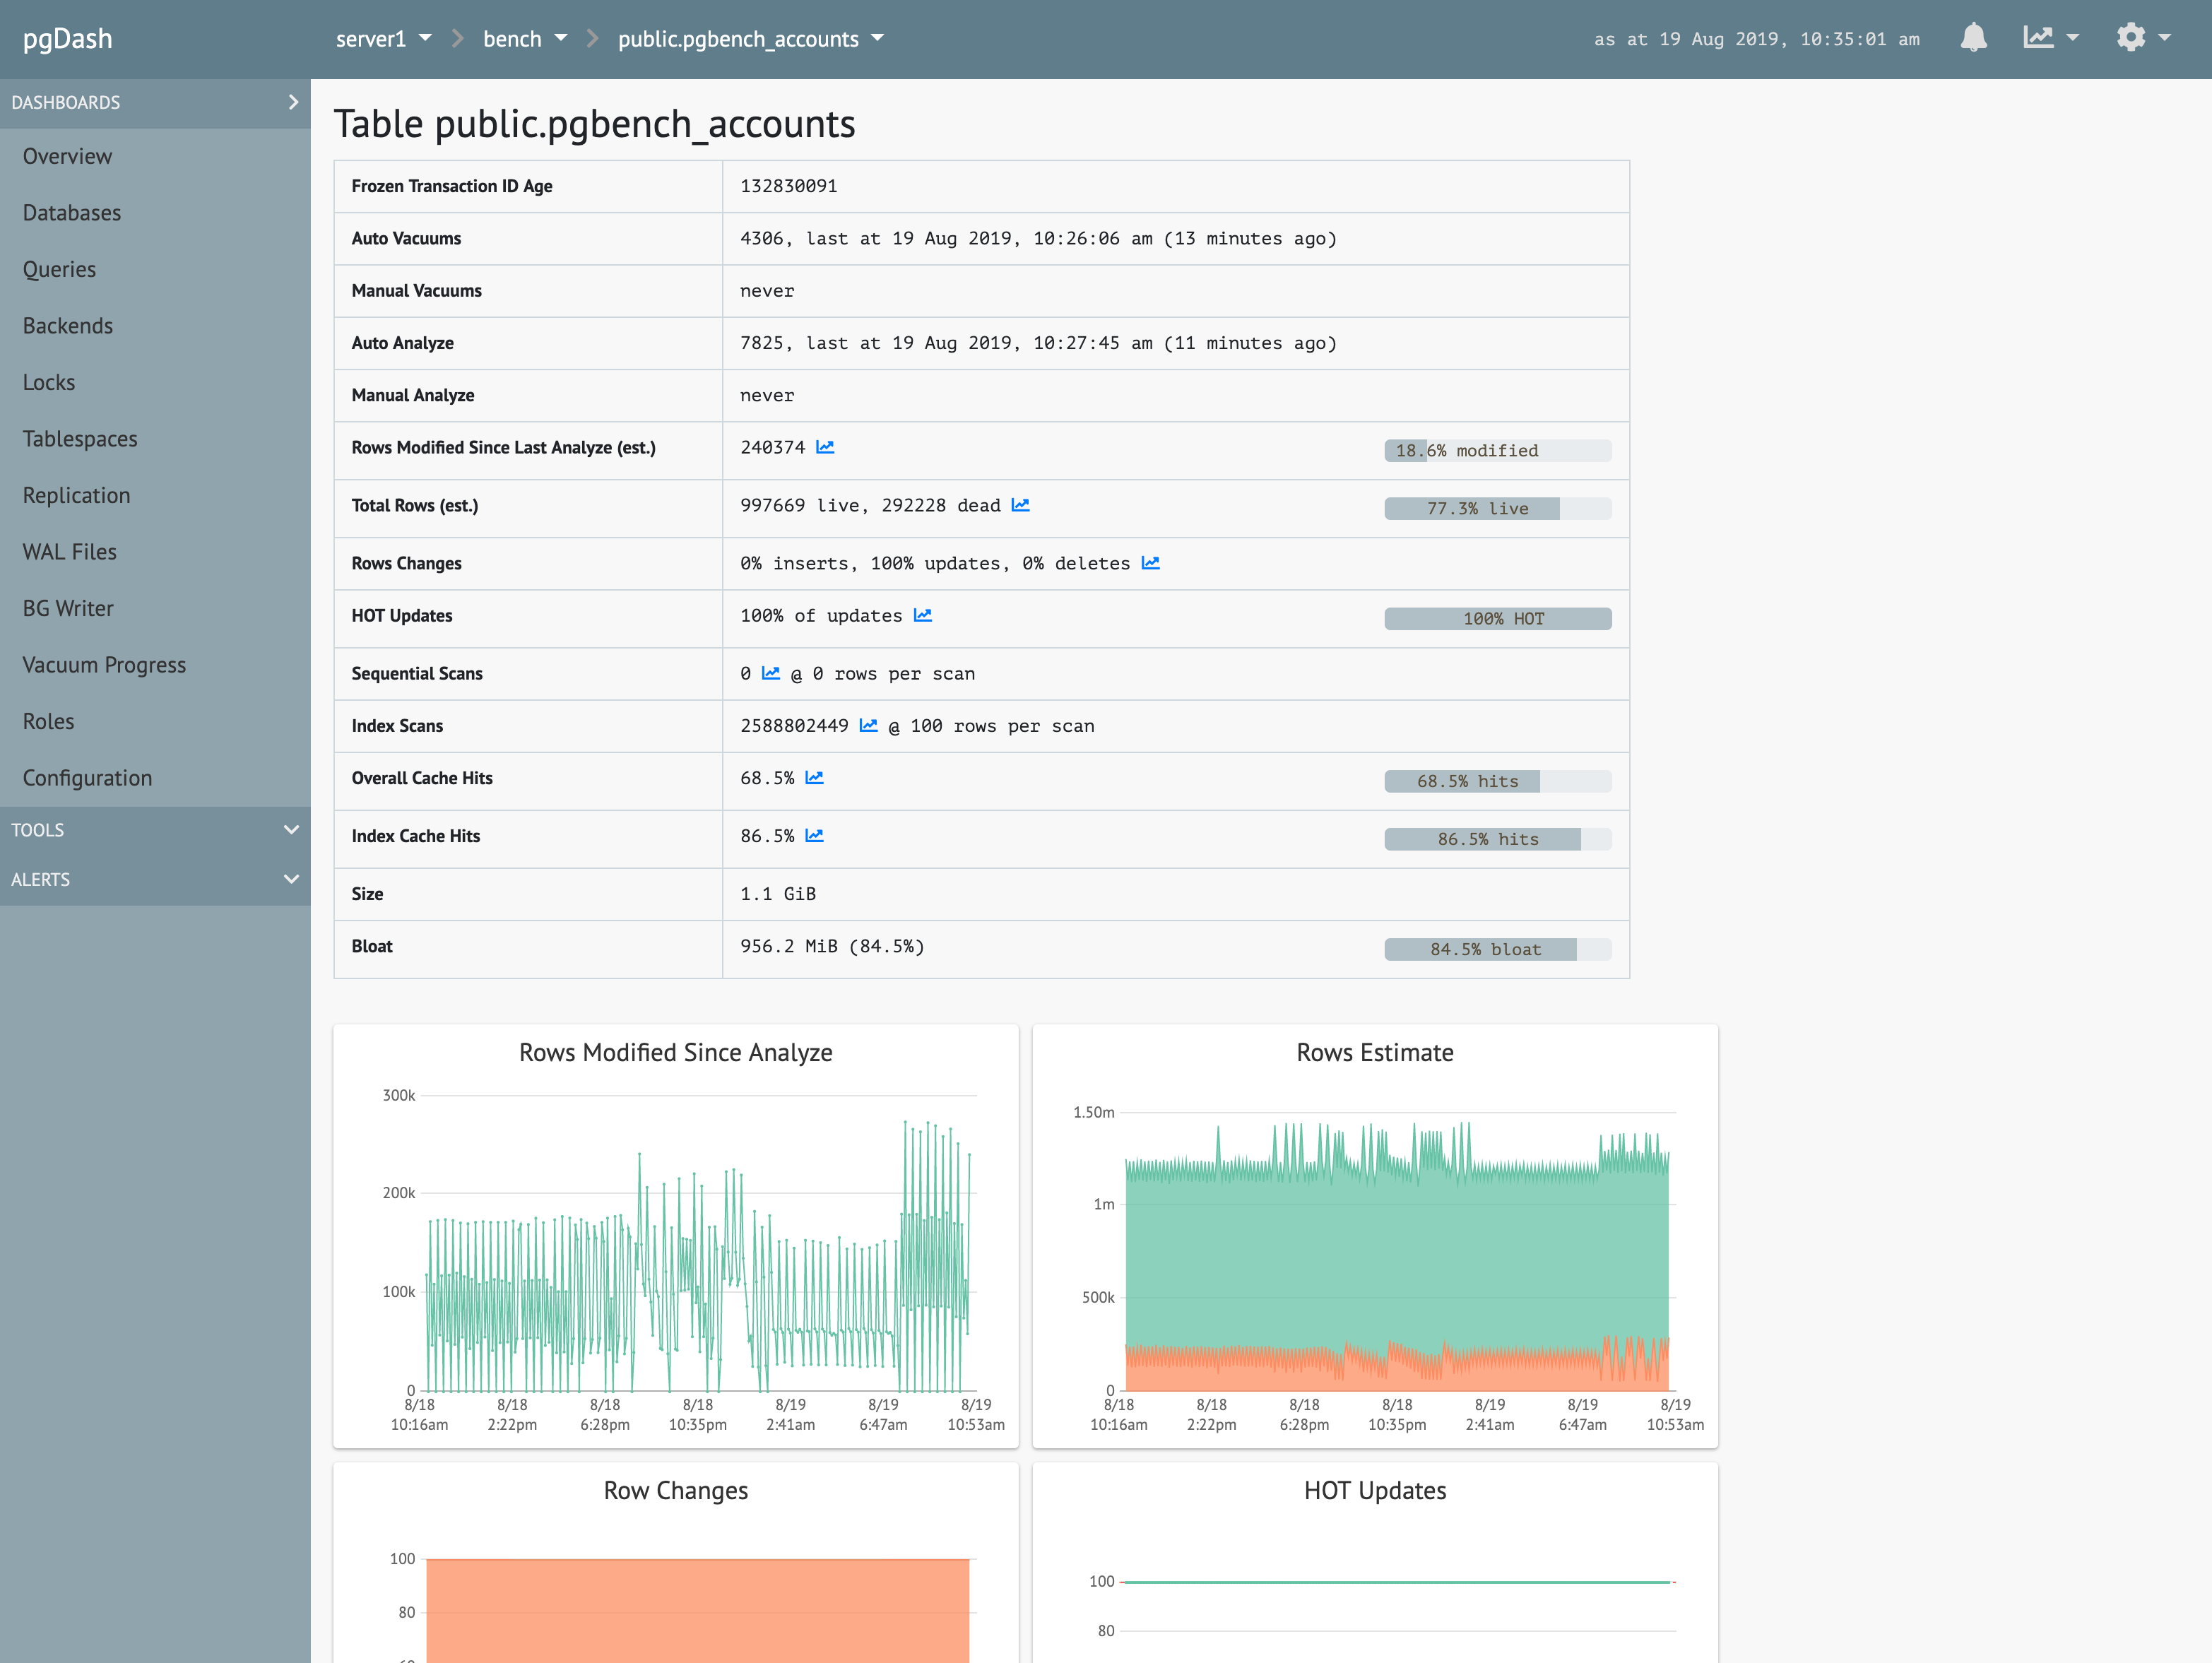
pgDash shows you information about each table and index, like size, bloat, activity, vacuum and analyze information, cache efficiency and more.

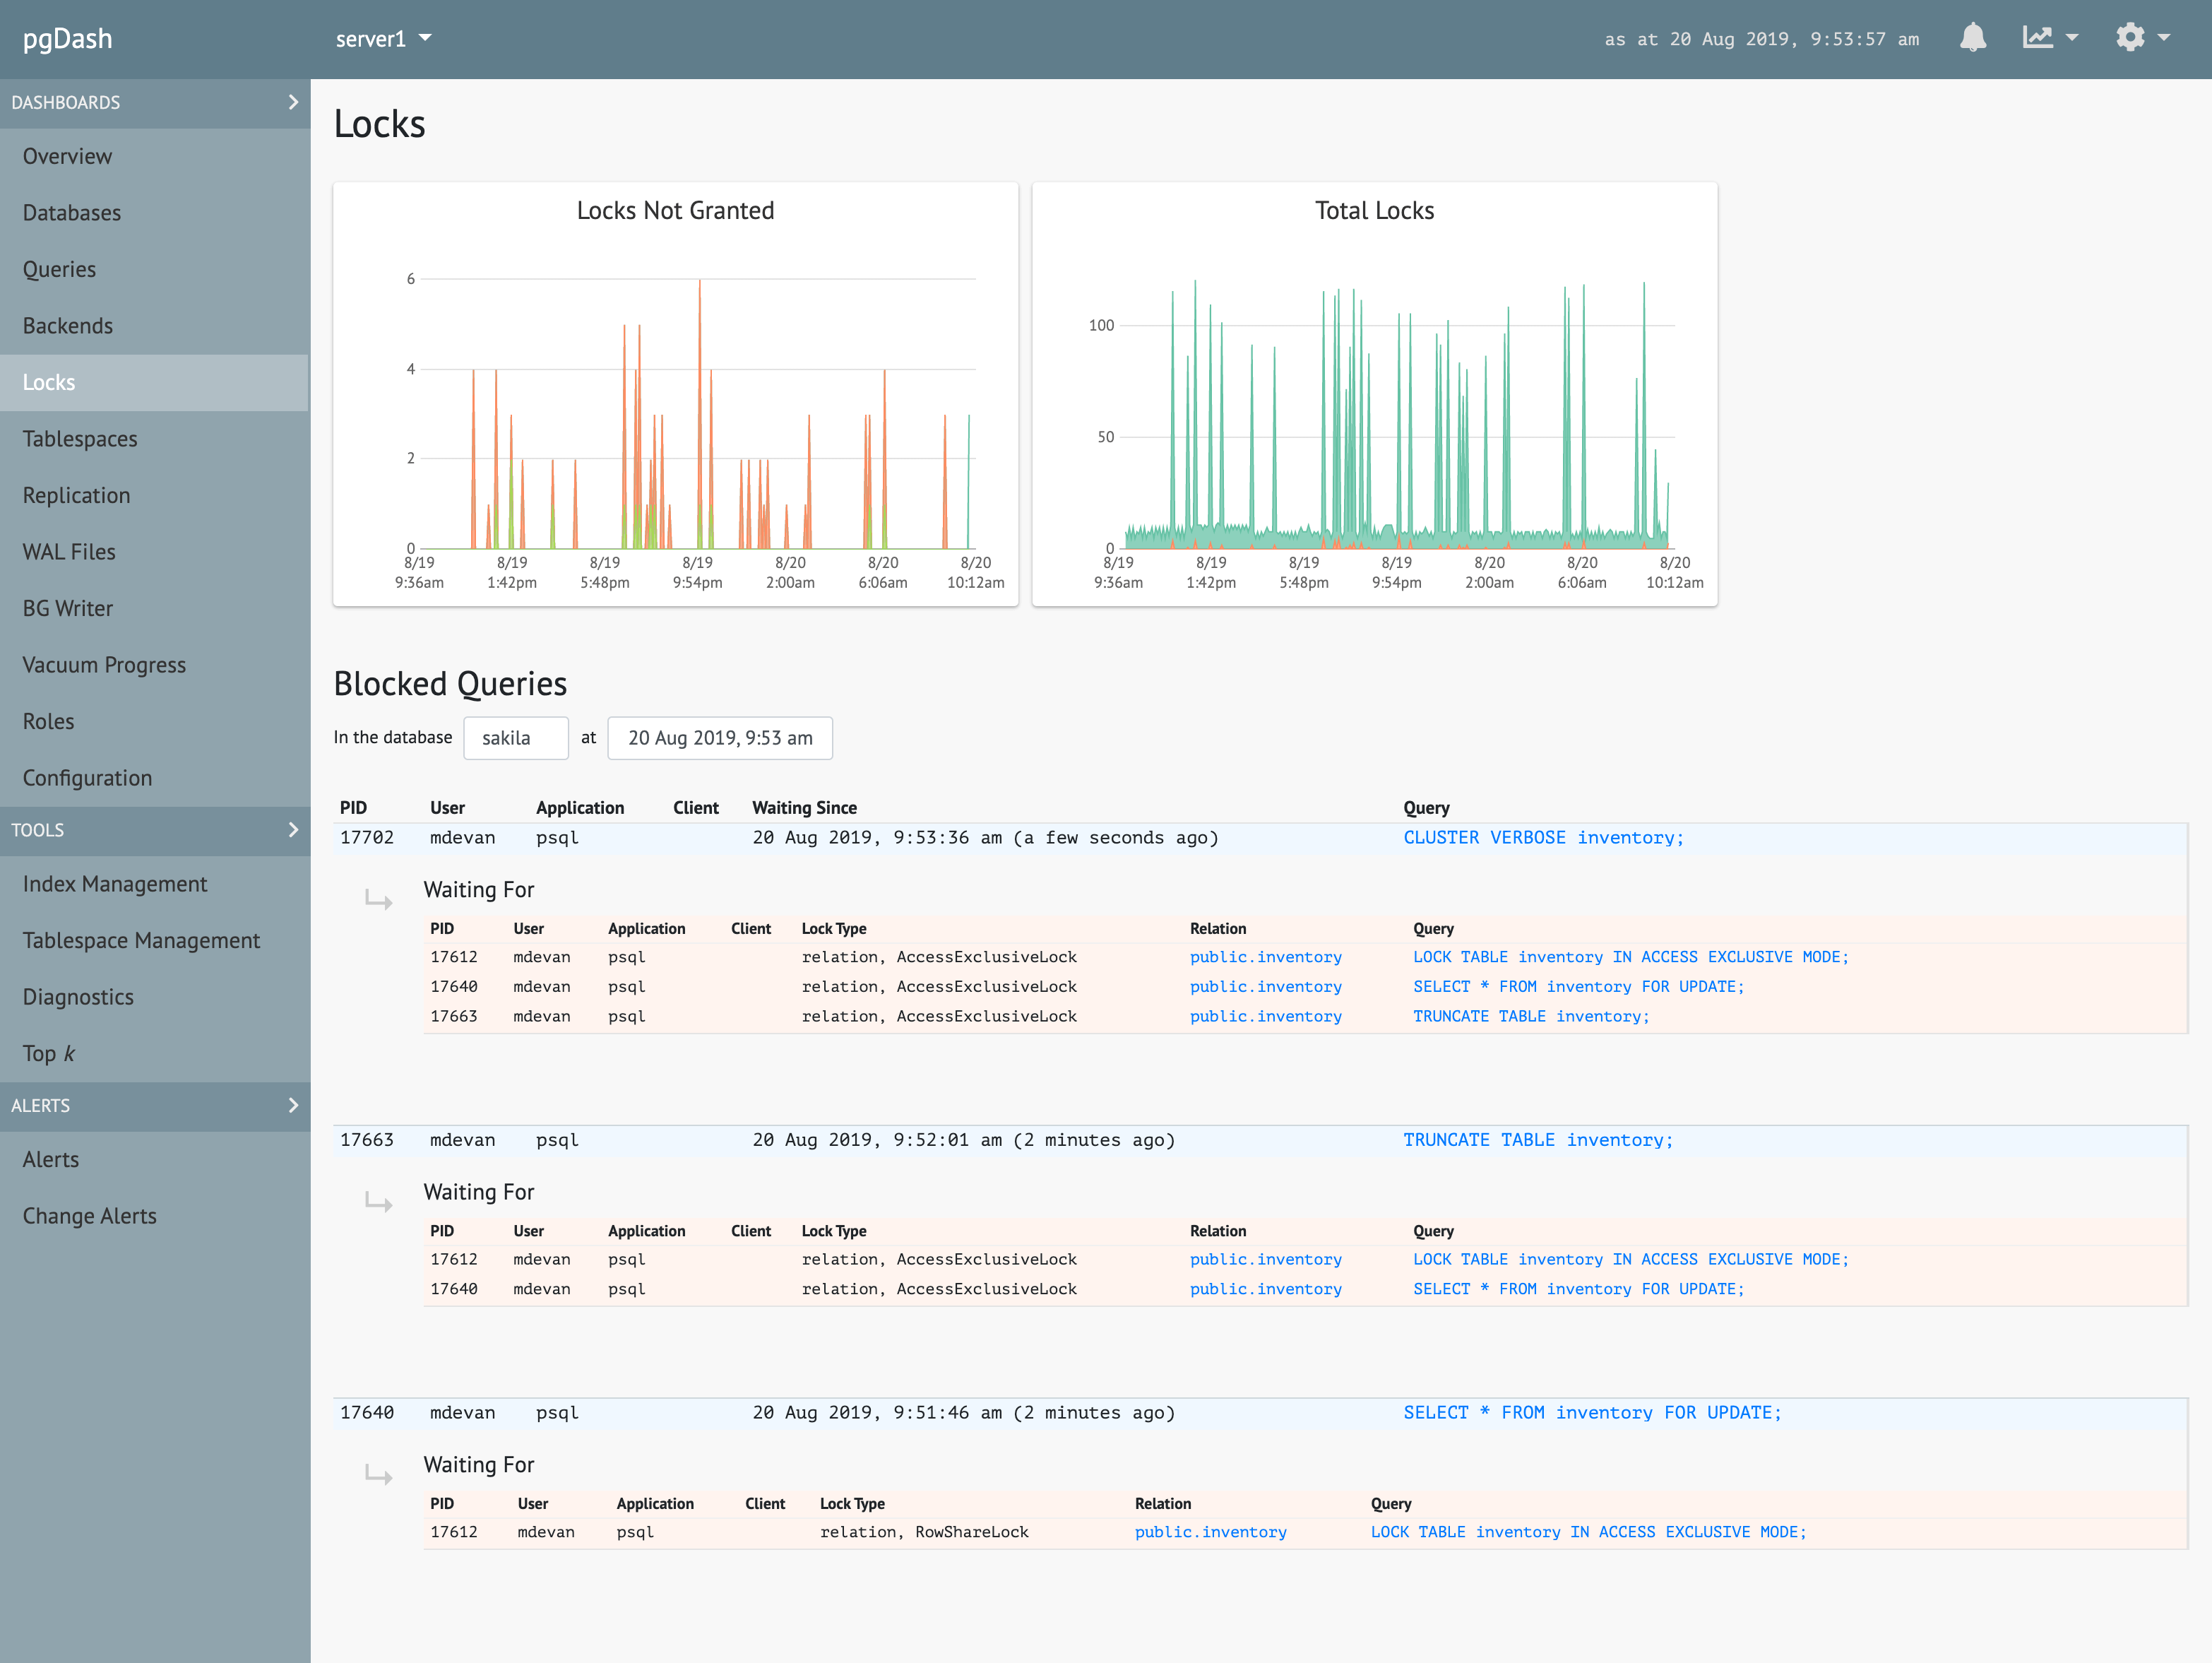
See which queries and waiting for which others. Track backends waiting on locks, transactions that have been open too long, idling transactions.

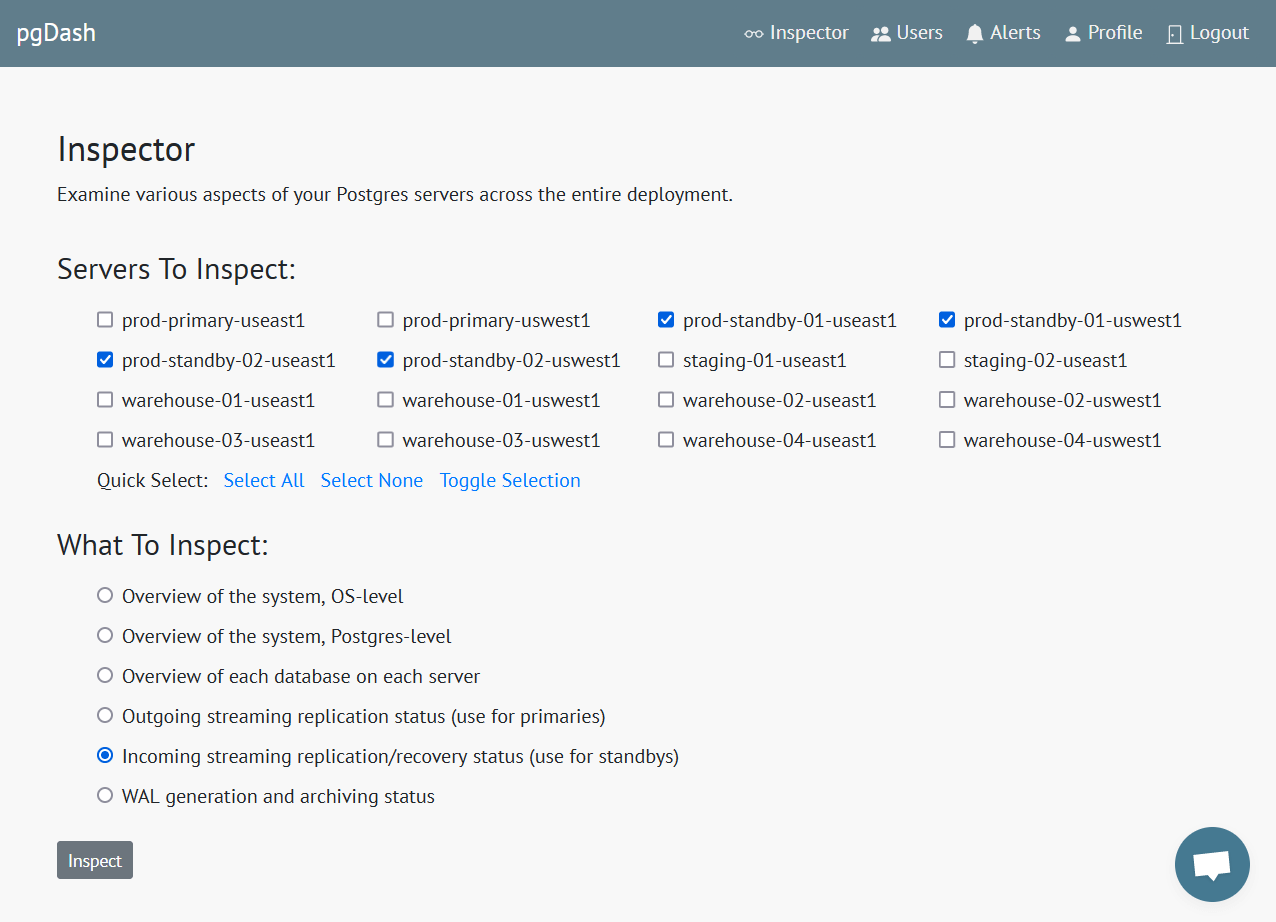
Quickly pull up dashboards for key subsystem health and performance indicators across your entire fleet of Postgres servers and databases.

Teams

pgDash lets you share all the data for a server with your team members. The team member you're sharing it with can view all information, metrics and graphs, but will not be able to delete any server data. Team sharing is available in the Pro and Enterprise versions of pgDash SaaS and self-hosted / on-premise.

Integrations

pgDash can collect metrics from other systems associated with your PostgreSQL server to provide a comprehensive picture of the entire system status. pgDash currently supports AWS CloudWatch (information about your AWS RDS instances and Aurora Replicas via the AWS CloudWatch and CloudWatch Logs APIs), PgBouncer (monitor your PgBouncer's pooling efficiency, load and client wait time to ensure that PgBouncer does not have a negative impact on application query latency) and Pgpool (track Pgpool load balancing effectiveness, health check status, per-backend metrics and in-memory query cache statistics).

Alerting

pgDash Basic Alerting lets you set meaningful alerts, like “Commit Ratio of mydb is less than 80%”, “Number of backends waiting on locks is greater than 30”, and get notificatied via email, Slack, PagerDuty, VictorOps, xMatters and Webhooks. Change Alerts automatically inform you about important changes to your PostgreSQL databases, like addition or deletion of users, tables, indexes, or abrupt increases or decreases in table size, and more. Change Alerts are available in the Pro and Enterprise versions of pgDash SaaS and self-hosted / on-premise.

AI-enhanced Chat (beta)

Now available in beta, pgDash includes an AI-enhanced chat feature that provides information and insights about your PostgreSQL server. The AI can answer questions and provide information about the status, configuration and performance of your PostgreSQL server. Talk to it in natural English sentences and get answers in real-time. Learn more.

And More

Configuration tuning, Index management, Tablespace management, WAL archiving metrics, BG Writer stats, vaccum progress information, roles including group membership. Works well with AWS RDS, Aurora and Citus too. On-premise option so you can run pgDash yourself if you prefer.


Dedicated vs Generic

pgDash collects hundreds of pieces of information and metrics about your Postgres server and brings it together into a comprehensive monitoring model. More than dashboards and alerts, it lets you reason out issues like why the WAL files keep increasing or which indices have not been used in the last month all from a single UI.


“pgDash has been a welcome addition to our PostgreSQL toolkit. With pgDash we are able to quickly discover and diagnose issues with our deployment. pgDash was easy to setup and has been working very well for us.”

— Jean-Yves Sireau, Founder, Binary.com


Try pgDash Today!


Signup

14-day free trial — no credit card required