What metrics of your PostgreSQL deployment should you be monitoring? This series of blog posts aims to provide a minimal, starting set of essential monitoring actions that you should implement to ensure the health and stability of your Postgres servers.
This is the third and final part of a blog series, and covers table-, index- and system-level metrics. The first one covered cluster-level metrics and the second one covered database-level metrics.
Table Level
Typically, data in a database follows the 80-20 rule. 20% of the tables contain most of the data and are accessed or mutated the most. Setting up extra monitoring just for these tables can provide insights that are important yet low-volume.
Here are some table-level metrics worth looking at:
1. Table Size
The actual disk size used by the table has to be monitored. In most cases, the table keeps on growing, so it is the growth rate that is more interesting.
It’s often the case that the growth rate changes after the rollout of a new version of the application, or a baseline change in traffic/load/input patterns of the application itself. Such changes must be investigated, at least to verify that new rate is sustainable by the provisioned hardware.
Action: Monitor the increase in size of the table over each week/month, investigate abrupt changes.
How To:
-- returns the size for each table
SELECT schemaname || '.' || relname,
       pg_size_pretty(pg_table_size(schemaname || '.' || relname))
  FROM pg_stat_user_tables;
2. Table Bloat
Because of Postgres’ MVCC architecture, older versions of rows lie around in the physical data files for every table, and is termed bloat. The operation to clear out obsolete row versions is called vacuum. Postgres runs a background process called autovacuum, which picks up candidate tables (based on configurable parameters) and vacuums them for you.
Bloat slows down table operations and wastes disk space, and can run away even with autovacuum. Monitoring of bloat, as an absolute number of bytes as well as a percentage (of dead data to total data), is required.
This metric can be monitored either at individual table level, or as an aggregate across selected tables, or at the database level.
Action: Continuously monitor table bloat as bytes and percentage, alert if values exceed a set threshold, VACUUM as necessary.
How To:
Use check_postgres or pgmetrics to get bloat estimates. See the wiki for more info.
3. Sequential Scans
When queries are executed that do not optimally use the available indexes, or if the statistical information associated with a table is too out-of-date, Postgres might end up having to go through each row of the table. This is called a sequential scan, and is not very desirable in the general case. What would be better to have is an index scan, where the rows of a table are accessed indirectly via index lookup.
PostgreSQL can tell you how many times a table was scanned sequentially, and how many times an index was used. You can use this to monitor either the number of sequential scans (if you’d like to avoid them totally) or as a percentage of total scans.
Action: Continuously monitor the seq. scans count or percentage, alert if value exceeds a set threshold.
How To:
-- returns the no. of seq. scans and the percentage of seq. scans for each table
SELECT schemaname || '.' || relname,
        seq_scan,
        round(seq_scan::numeric*100/(seq_scan+idx_scan), 1)
 FROM pg_stat_user_tables
WHERE seq_scan+idx_scan > 0;
Index Level
1. Index Size
Indexes can take up considerable disk space. Each index of a table can itself potentially have as much disk footprint as the table itself. It is useful to keep an eye on the total size of indexes in a database, or the indexes of important tables, especially in deployments where indexes can get created through automatic processes.
Unreasonably large indexes can be because of bloat, or just a badly designed index. In either case fixing the cause (either by rebuilding the index or by refactoring the query/index) can yield faster query times, so it is worth investigating large indexes.
Action: Monitor the total size of interesting indexes over each week/month, investigate when unreasonably large.
How To:
-- returns the size for each index
SELECT schemaname || '.' || indexrelname,
       pg_size_pretty(pg_total_relation_size(indexrelid))
  FROM pg_stat_user_indexes;
2. Index Bloat
Indexes can get bloated too. There are far too many factors, including table workload, index type, Postgres version and more, that decides how bloated an index becomes. Bloated indexes can slow down inserts and reduce lookup performance. Monitor the bloat of indexes as both an absolute value (number of bytes) and as a percentage. Indexes will have to be rebuilt when they become too bloated.
Action: Continuously monitor index bloat as bytes and percentage, alert if values exceed a set threshold.
How To:
Use check_postgres or pgmetrics to get bloat estimates. See the wiki for more info.
3. Cache Hit Ratio
PostgreSQL caches frequently accessed regions of indexes (and also tables) in memory. If you have tuned your queries not to touch the tables except for retrieving rows, the next step is to ensure maximum cache residency for those important indexes that are really speeding up your queries.
The cache utilization of an index can be measured by the cache hit ratio, which is the percentage of blocks of the index that were read from the cache to the total number of blocks read.
Action: Continuously monitor the cache hit ratio percentage, alert if value falls below a set threshold. Investigate low values for important indexes.
How To:
-- returns the cache hit ratio as a percentage, for each index
  SELECT schemaname || '.' || indexrelname AS index_name,
           round(pg_stat_get_blocks_hit(indexrelid)::numeric*100 /
         pg_stat_get_blocks_fetched(indexrelid), 1) AS cache_hit_ratio
    FROM pg_stat_user_indexes
   WHERE pg_stat_get_blocks_fetched(indexrelid) > 0
ORDER BY cache_hit_ratio DESC;
System Level
Apart from PostgreSQL metrics, it is important to keep track of a few metrics of the machine or VM that you are running your Postgres on. You can use any popular monitoring solution for this, or even grab and track them yourself.
1. Used Memory
Modern Linux systems have complex memory accounting. We recommend monitoring the “used memory”, which is the memory left after accounting for memory marked as free, as buffers, as cached, and as slab. Buffers and cache will give way under pressure, and so will most (typically over 95%) of slab.
The used memory, however, must be measured over a suitably long period. If you have batch jobs, reports, ETL etc. that run on weekends, then the period would be one week. The real metric you’ll need to monitor is the maximum used memory over this period.
Typically, as your database size grows, this value tends to creep up. You’ll have to ensure the maximum memory usage is within a comfortable limit of available memory, like say 60-80%. Neglecting this would cause your analytics/OLAP workloads to fail for lack of memory.
Action: Monitor the maximum used memory over a week/fornight, alert if it exceeds a set threshold, reprovision.
How To:
The used memory is given by MemUsed = MemTotal - MemFree - MemBuffers - MemCached - MemSlab,
where the Mem* fields are from /proc/meminfo. For more information, see
this RedHat article.
2. Load Average
The simple load average value is still the easiest and quickest way to estimate the load on a server. This is especially true for Postgres servers, as each backend is a separate OS process, and having more of them in a runnable state will increase the load average value.
For a given Postgres server, the load average should stay within a reasonable range over a business cycle (like one week, including batch job runs).
Action: Monitor the maximum load average over each day/week, investigate increasing trends.
How To:
The 1 minute, 5 minute and 15 minute load averages are the first 3 fields of
the first line in the file /proc/loadavg.
3. Free Disk Space
The last item in our list is the most obvious item to monitor: the amount of free disk space in each filesystem used by your PostgreSQL server, including tablespaces, WAL file directories, backup directories and server log files. In cases where too many (100s of millions) files get created in a single filesystem, ensure that the free inode count is also monitored. Lack of inodes are also reported as low disk space.
Action: Continuously monitor free disk space and inode usage on all relevant filesystems, alert if values fall below a set threshold.
How To:
Free disk space in a filesystem is not retrievable directly by reading any
file in /proc. You can use stat -f /path/to/mount or even df to find
out the used, free and reserved disk space for a specific, mounted filesystem.
Quick Reference
Here is a full list of all the metrics we have discussed so far in this series. Remember that these are only the minimal, most essential, set of metrics that you must monitor in order to detect when things are about to go wonky with your PostgreSQL deployment.
Cluster Level
- Transaction ID Range
- Number of Backends
- Inactive Replication Slots
- Backends Waiting on Locks
- Backends Idling in Transaction
- Replication Lag for Active Connections
- Replication Lag for Replication Slots
- WAL File Count
- Ready-to-archive WAL file count
Database Level
- Connected Clients
- Size
- Table Bloat Across All Tables
- Index Bloat Across All Indexes
- Long Running Transactions
- Deadlocks
- Oldest Vacuum
- Oldest Analyze
Table Level
- Table Size
- Table Bloat
- Sequential Scans
Index Level
- Index Size
- Index Bloat
- Cache Hit Ratio
System-Level
- Used Memory
- Load Average
- Free Disk Space
Collecting These Metrics
The sections above provide SQL statements to extract the needed metrics from a running Postgres server. If you’d rather not write the scripts yourself, check out the open source tool pgmetrics. It can collect the metrics above, and more, and report them in text and JSON formats.
You can directly send the pgmetrics reports to our commercial offering, pgDash, which stores and processes these reports to display graphs and perform alerting.
About pgDash
pgDash is a modern, in-depth monitoring solution designed specifically for PostgreSQL deployments. pgDash shows you information and metrics about every aspect of your PostgreSQL database server, collected using the open-source tool pgmetrics.
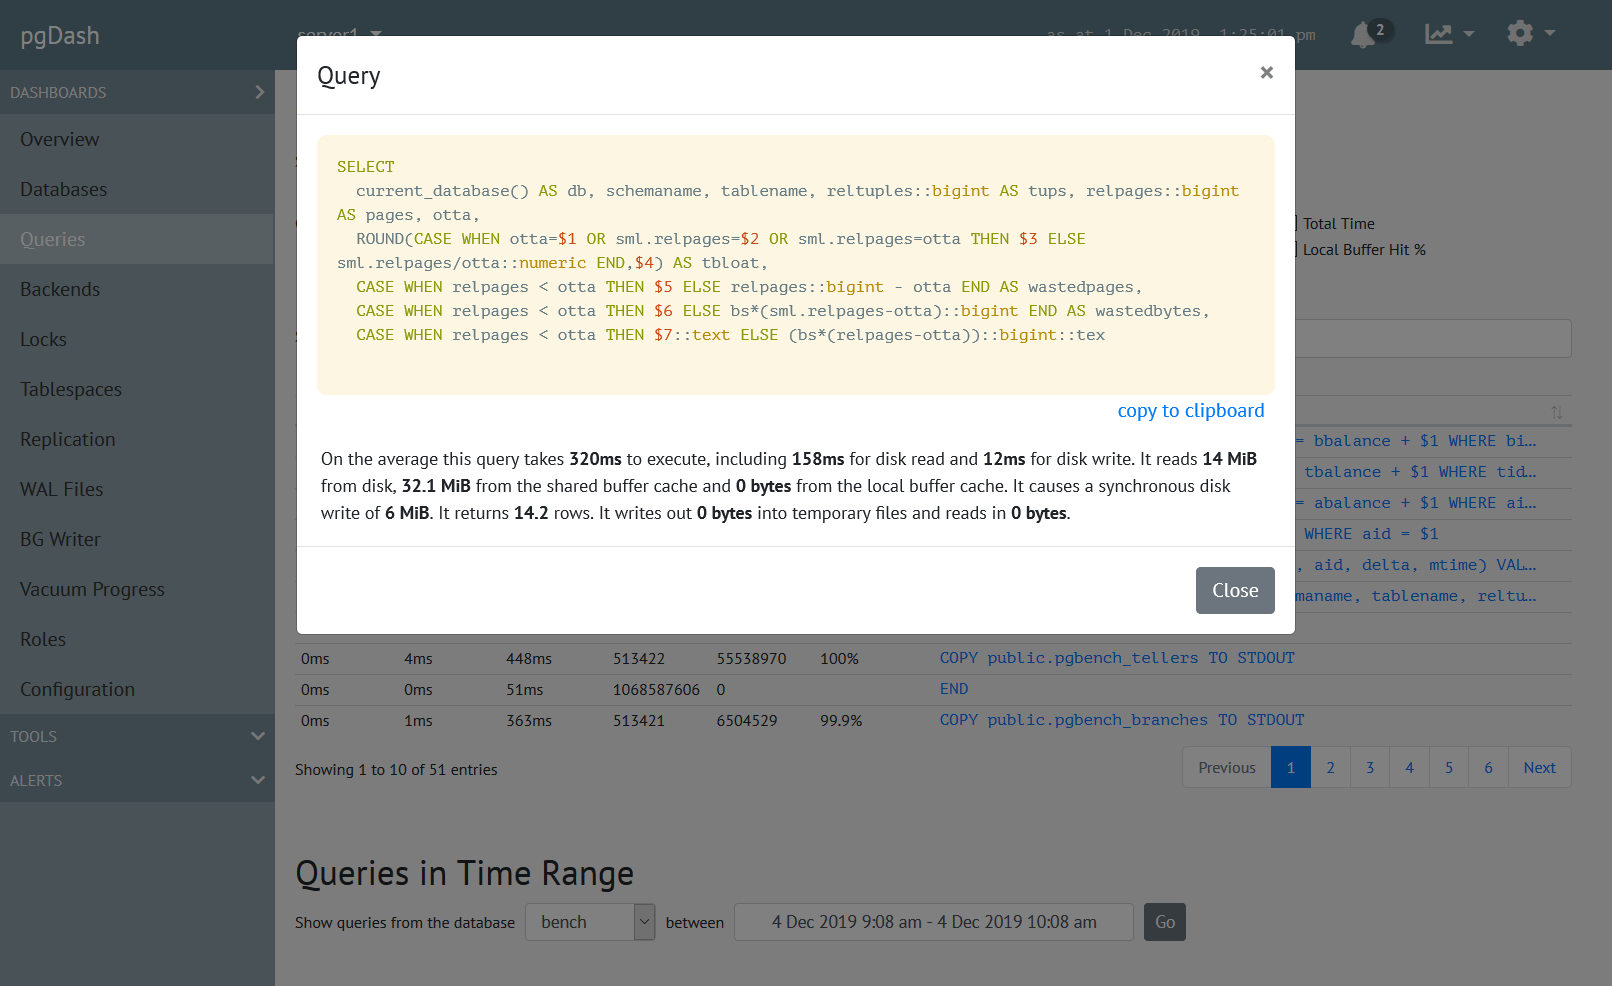
pgDash provides core reporting and visualization functionality, including collecting and displaying PostgreSQL information and providing time-series graphs, detailed reports, diagnostics, alerting, teams and more. Checkout the features here or signup today for a free trial.